Link to the original text
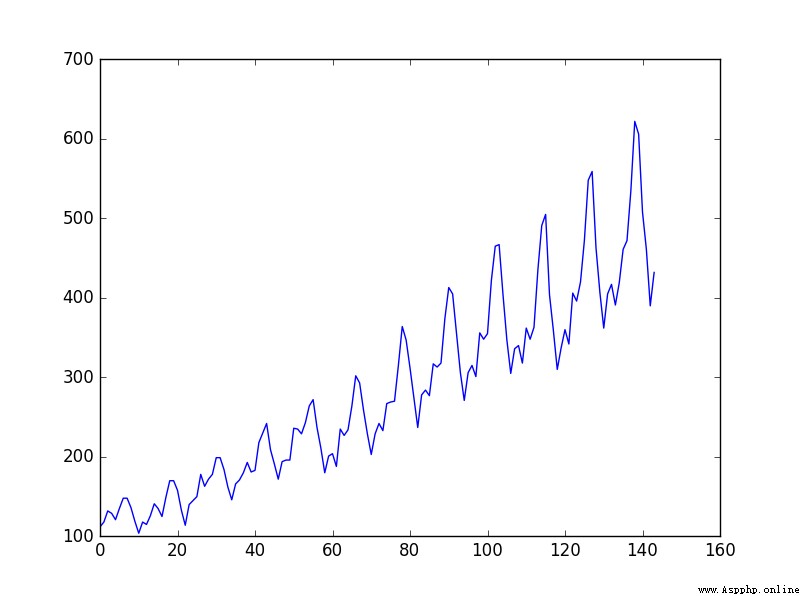
This problem is an international airline passenger forecasting problem , The data is 1949 year 1 Month to 1960 year 12 Monthly number of passengers of international airlines per month ( Company : One thousand people ), share 12 year 144 Months of data .
link :https://pan.baidu.com/s/1JJTe2CL0BxpmyewKCsvc0w Extraction code :6666
Data trends :
Training program :
import numpy as np
import pandas as pd
import matplotlib.pyplot as plt
import torch
from torch import nn
from torch.autograd import Variable


#LSTM(Long Short-Term Memory) It's the long and short term memory network
data_csv = pd.read_csv('C:/Users/DZF/Desktop/LSTM/data.csv',usecols=[1])
#pandas.read_csv Can read CSV( Comma split ) file 、 Text files text、log Type to DataFrame
# Original two columns , Time and number of passengers ,usecols=1: Only one passenger train was taken

plt.plot(data_csv)
plt.show()
# Data preprocessing
data_csv = data_csv.dropna() # Get rid of na data
dataset = data_csv.values      # Dictionaries (Dictionary) values(): Returns all values in the dictionary .
dataset = dataset.astype('float32')   #astype(type): Implement variable type conversion
max_value = np.max(dataset)
min_value = np.min(dataset)
scalar = max_value-min_value
dataset = list(map(lambda x: x/scalar, dataset)) # Standardize data to 0~1 Between
#lambda: Define an anonymous function , The difference in def
#map(f(x),Itera):map() Receiver function f And a list, Put function f Acting in turn list On each element of , Get a new one object And back to


'''
 Then we create the data set , We want to predict the traffic of the current month through the traffic of the previous months ,
 For example, we hope to predict the traffic of the current month through the traffic of the first two months , We can take the traffic of the first two months
 As input , The flow of the current month is regarded as the output . At the same time, we need to divide our data set into training set and test set
 Set , Test the performance of the model through the effect of the test set , Here we simply take the data of previous years as
 Training set , The data of the next two years are used as the test set .
'''
def create_dataset(dataset,look_back=2):#look_back  The previous time steps are used as input variables to predict the next time period
    dataX, dataY=[], []
    for i in range(len(dataset) - look_back):
        a = dataset[i:(i+look_back)]  #i and i+1 assignment
        dataX.append(a)
        dataY.append(dataset[i+look_back])  #i+2 assignment
    return np.array(dataX), np.array(dataY)  #np.array Building arrays

data_X, data_Y = create_dataset(dataset)
#data_X: 2*142     data_Y: 1*142

# Divide the training set and the test set ,70% As a training set
train_size = int(len(data_X) * 0.7)
test_size = len(data_X)-train_size

train_X = data_X[:train_size]
train_Y = data_Y[:train_size]

test_X = data_X[train_size:]
test_Y = data_Y[train_size:]

train_X = train_X.reshape(-1,1,2) #reshape in ,-1 Make the element a line , And then the output is 1 Column , Each column 2 Sub elements
train_Y = train_Y.reshape(-1,1,1) # Output is 1 Column , Each column 1 Sub elements
test_X = test_X.reshape(-1,1,2)


train_x = torch.from_numpy(train_X) #torch.from_numpy(): numpy Medium ndarray Turn it into pytorch Medium tensor( tensor )
train_y = torch.from_numpy(train_Y)
test_x = torch.from_numpy(test_X)


# Defining models   Input dimensions input_size yes 2, Because use 2 Months of flow as input , Hidden layer dimensions hidden_size Can be specified arbitrarily , Here for 4
class lstm_reg(nn.Module):
    def __init__(self,input_size,hidden_size, output_size=1,num_layers=2):
        super(lstm_reg,self).__init__()
        #super()  Function is used to call the parent class ( Superclass ) One way , Call the parent class directly with the class name
        self.rnn = nn.LSTM(input_size,hidden_size,num_layers) #LSTM  The Internet
        self.reg = nn.Linear(hidden_size,output_size) #Linear  Function inherited from nn.Module
    def forward(self,x):   # Definition model Class forward function
        x, _ = self.rnn(x)
        s,b,h = x.shape   # The dimension of a matrix from outside to inside
                   #view() Function and reshape similar , To convert size size
        x = x.view(s*b, h) # The output changes to (s*b)*h Two dimensions of
        x = self.reg(x)
        x = x.view(s,b,-1) # The dimension of the output of convolution from outside to inside is s,b, A column of
        return x

net = lstm_reg(2,4) #input_size=2,hidden_size=4

criterion = nn.MSELoss()  # Mean square deviation of loss function
optimizer = torch.optim.Adam(net.parameters(),lr=1e-2)
# Construct an optimizer object  Optimizer, Used to save the current state , The parameters can be updated according to the calculated gradient
#Adam  Algorithm :params (iterable): Parameters that can be used for iterative optimization or for defining parameter groups  dicts   lr: Learning rate


for e in range(10000):
    var_x = Variable(train_x) # To Variable( Variable )
    var_y = Variable(train_y)

    out = net(var_x)
    loss = criterion(out, var_y)

    optimizer.zero_grad() # Set the gradient to zero , That is the loss About weight The derivative of becomes 0.
    loss.backward()  # To calculate the loss After that, the loss will be returned , This is an operation that only happens during training , During the test, only forward The process
    optimizer.step() # The accounting gradient in the process of returning the loss , then optimizer.step() Update the parameters according to these gradients
    if (e+1)%100 == 0:
        print('Epoch: {}, Loss:{:.5f}'.format(e+1, loss.data[0]))

torch.save(net.state_dict(), 'net_params.pkl') # Save training files net_params.pkl
#state_dict  It's a simple one python The dictionary object of , Map each layer to its corresponding parameters
The test program :
import numpy as np
import pandas as pd
import matplotlib.pyplot as plt
import torch
from torch import nn
from torch.autograd import Variable
data_csv = pd.read_csv('C:/Users/DZF/Desktop/LSTM/data.csv',usecols=[1])
# plt.plot(data_csv)
# plt.show()
# Data preprocessing
data_csv = data_csv.dropna() # Get rid of na data
dataset = data_csv.values # Dictionaries (Dictionary) values(): Returns all values in the dictionary .
dataset = dataset.astype('float32') # astype(type): Implement variable type conversion
max_value = np.max(dataset)
min_value = np.min(dataset)
scalar = max_value-min_value
dataset = list(map(lambda x: x/scalar, dataset)) # Standardize data to 0~1 Between
def create_dataset(dataset,look_back=2):
dataX, dataY=[], []
for i in range(len(dataset)-look_back):
a=dataset[i:(i+look_back)]
dataX.append(a)
dataY.append(dataset[i+look_back])
return np.array(dataX), np.array(dataY)
data_X, data_Y = create_dataset(dataset)
class lstm_reg(nn.Module):
def __init__(self,input_size,hidden_size, output_size=1,num_layers=2):
super(lstm_reg,self).__init__()
self.rnn = nn.LSTM(input_size,hidden_size,num_layers)
self.reg = nn.Linear(hidden_size,output_size)
def forward(self,x):
x, _ = self.rnn(x)
s,b,h = x.shape
x = x.view(s*b, h)
x = self.reg(x)
x = x.view(s,b,-1)
return x
net = lstm_reg(2,4)
net.load_state_dict(torch.load('net_params.pkl'))
data_X = data_X.reshape(-1, 1, 2) #reshape in ,-1 Make the element a line , And then the output is 1 Column , Each column 2 Sub elements
data_X = torch.from_numpy(data_X) #torch.from_numpy(): numpy Medium ndarray Turn it into pytorch Medium tensor( tensor )
var_data = Variable(data_X) # To Variable( Variable )
pred_test = net(var_data) # Produce prediction results
pred_test = pred_test.view(-1).data.numpy() #view(-1) Output as a line
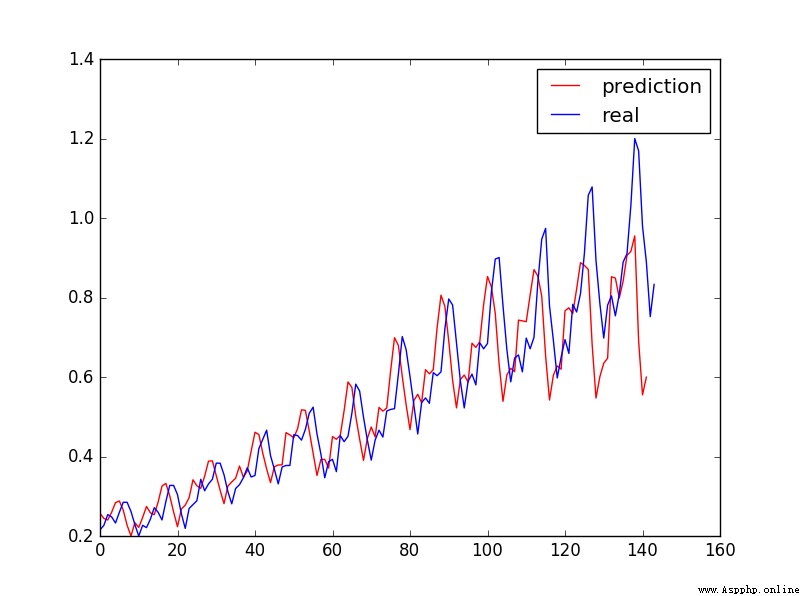
plt.plot(pred_test, 'r', label='prediction')
plt.plot(dataset, 'b', label='real')
plt.legend(loc='best') #loc Display images 'best' Indicates the adaptive mode
plt.show()
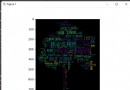
Predicted results :
Learn more about programming , Please pay attention to my official account :
The way of code

This paper is written by mdnice Multi platform Publishing