Recent work needs , Doing user path analysis , I hereby write this article to record
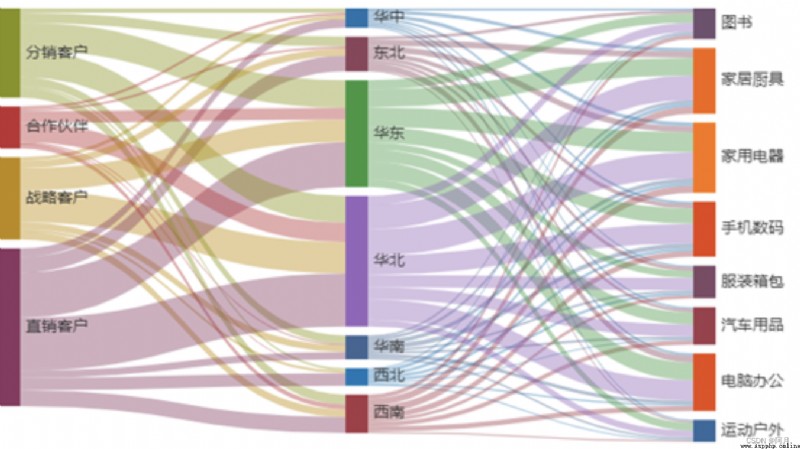
The mainstream mulberry map on the Internet is probably as shown in the figure below , Our article also restores the following effects
Realize mulberry diagram , I borrowed python Of pyecharts Components
pyecharts It's actually Echarts And python Docking
pip3 install pyecharts
pip3 install openpyxl
Attach the official document :https://gallery.pyecharts.org/#/README
import pandas as pd from pyecharts.charts import Sankey from pyecharts import options as opts import os from pyecharts.charts import Pie,Bar,Map,Page,Funnel def get_data(df): nodes =[] for i in range(2): vales=df.iloc[:,i].unique() for value in vales: dic={
}
dic['name']=value nodes.append(dic) nodes1 = [] for id in nodes: if id not in nodes1: nodes1.append(id) # print(nodes1) links=[] for i in df.values: dic={
}
dic['source']=i[0]
dic['target']=i[1]
dic['value']=i[2]
links.append(dic)
return nodes1,links
# print(links)
def get_tu(tablename,df):
nodes1,links = get_data(df)
sankey = (
Sankey(init_opts=opts.InitOpts(width="2000px", height="800px"))
.add(
tablename,
nodes1,
links,
pos_top="10%",
node_width = 30, # The width of each sangee rectangle
node_gap= 12, # The interval between any two rectangular nodes in each column of the sanggi graph .
is_draggable = True,
layout_iterations = 5,
# focus_node_adjacency=True,
itemstyle_opts=opts.ItemStyleOpts(border_width=2, border_color="#aaa"),
linestyle_opt=opts.LineStyleOpts(opacity=0.8, curve=0.5, color='source'),
label_opts=opts.LabelOpts(position='right'),
)
.set_global_opts(title_opts=opts.TitleOpts(title=" User path analysis "))
)
return sankey
file ='/Users/superyue/Desktop/tu/user2.xlsx'
df_0826 = pd.read_excel(file,sheet_name='result')
sk1 = get_tu('tets',df_0826)
sk1.render("/Users/superyue/Desktop/tu/test.html")
The effect is as follows :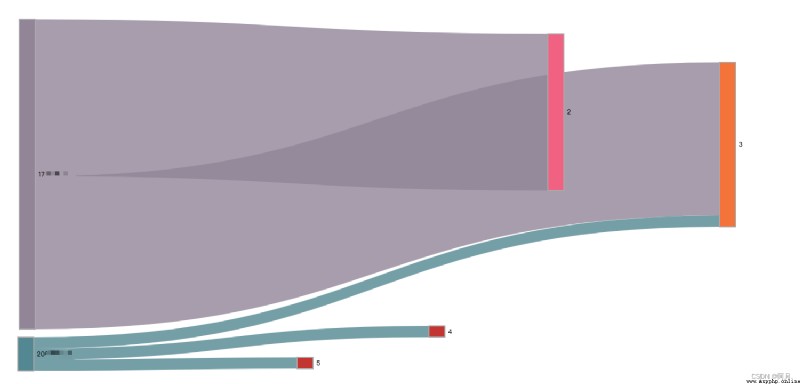
If data is thrown in , The program also runs successfully , But the effect picture can't come out
Then it must be source and target Corresponding excel Column duplicate
as well as source perhaps target Try not to appear INT Data of type ( Of course, it can also be modified through code )