import matplotlib.pyplot as plt
from matplotlib import font_manager
#設置使用的字體,此處使用的是微軟雅黑
my_font = font_manager.FontProperties(fname='C:\Windows\Fonts\MSYH.TTC')
x=list(range(5))
y=list(range(5))
plt.figure()
#畫折線圖
plt.subplot(2,2,1)
plt.xlabel('x軸',fontproperties = my_font)
plt.ylabel('y軸',fontproperties = my_font)
plt.title('折線圖',fontproperties = my_font)
plt.plot(x,y)
#柱狀圖
plt.subplot(2,2,2)
plt.xlabel('x軸',fontproperties = my_font)
plt.ylabel('y軸',fontproperties = my_font)
plt.title('柱狀圖',fontproperties = my_font)
plt.bar(x,y)
#離散圖
plt.subplot(2,2,3)
plt.xlabel('x軸',fontproperties = my_font)
plt.ylabel('y軸',fontproperties = my_font)
plt.title('離散圖',fontproperties = my_font)
plt.scatter(x,y)
plt.show()
運行結果如下: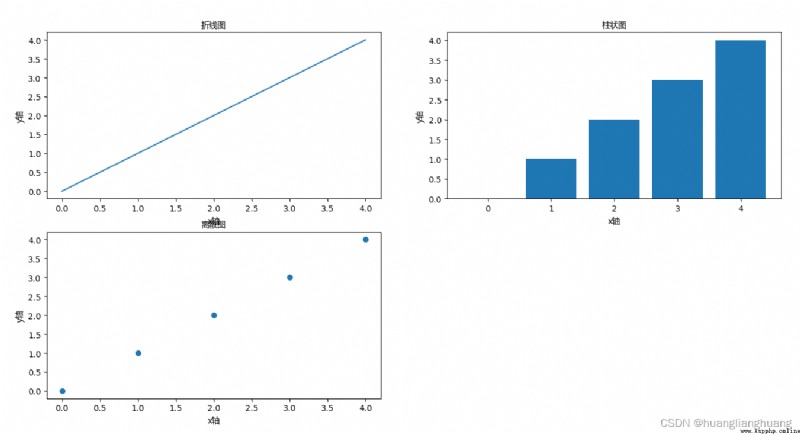
 Python calculates the area and perimeter of a circle. Analysis of the real problem of level 2 of the python programming level examination of the Electronic Society for youth programming march2021
Catalog python Calculate the a
 How to use the k-means algorithm to cluster image colors and achieve image compression?(with Python code + dataset)
整理不易,I hope that all the viewe