在這部分練習中,We will learn to operate on face imagesPCA,See how to use it in practice to reduce dimensionality.
老規矩,先放出數據集:
鏈接:https://pan.baidu.com/s/1R0oiqoWHV2iR8sc3YHkMoA
提取碼:6666
導入需要用到的包
from numpy import *
from scipy.io import loadmat
import matplotlib.pyplot as plt
導入數據
faces_data = loadmat('data/ex7faces.mat')
print(faces_data)
X=faces_data['X']
print(X.shape)
結果為:
{
'__header__': b'MATLAB 5.0 MAT-file, Platform: PCWIN64, Created on: Mon Nov 14 23:46:35 2011', '__version__': '1.0', '__globals__': [], 'X': array([[ -37.86631387, -45.86631387, -53.86631387, ..., -110.86631387,
-111.86631387, -99.86631387],
[ 8.13368613, -0.86631387, -8.86631387, ..., -34.86631387,
-8.86631387, 0.13368613],
[ -32.86631387, -34.86631387, -36.86631387, ..., -110.86631387,
-111.86631387, -111.86631387],
...,
[ -46.86631387, -24.86631387, -8.86631387, ..., 90.13368613,
80.13368613, 59.13368613],
[ 19.13368613, 16.13368613, 14.13368613, ..., -38.86631387,
-41.86631387, -46.86631387],
[-108.86631387, -106.86631387, -102.86631387, ..., 17.13368613,
17.13368613, 18.13368613]])}
(5000, 1024)
Explain that our dataset has 5000個樣本,每個樣本有1024個特征.
可視化
Let's visualize it before100張人臉圖像:
def plot_100_image(X):
fig,ax=plt.subplots(nrows=10,ncols=10,figsize=(10,10))
for c in range(10):
for r in range(10):
ax[c,r].imshow(X[10*c+r].reshape(32,32).T,cmap='Greys_r')
ax[c,r].set_xticks([])
ax[c,r].set_yticks([])
plt.show()
plot_100_image(X)
結果如下圖所示: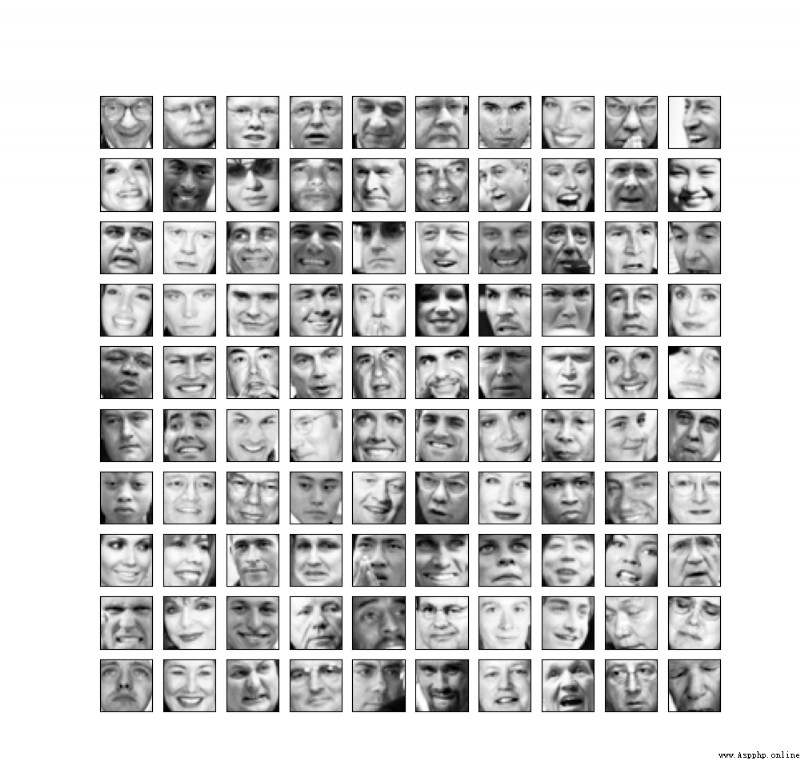
接下來我們應用PCAThe steps of the algorithm are consistent with the previous steps on the 2D dataset:
1.去均值化
2.計算協方差矩陣
3.計算特征值和特征向量
We will not go into detail,If you need it, you can read my previous blog:
https://blog.csdn.net/wzk4869/article/details/126074158?spm=1001.2014.3001.5502
Directly release the corresponding code:
def reduce_mean(X):
X_reduce_mean=X-X.mean(axis=0)
return X_reduce_mean
X_reduce_mean=reduce_mean(X)
def sigma_matrix(X_reduce_mean):
sigma=(X_reduce_mean.T @ X_reduce_mean)/X_reduce_mean.shape[0]
return sigma
sigma=sigma_matrix(X_reduce_mean)
def usv(sigma):
u,s,v=linalg.svd(sigma)
return u,s,v
u,s,v=usv(sigma)
print(u)
def project_data(X_reduce_mean, u, k):
u_reduced = u[:,:k]
z=dot(X_reduce_mean, u_reduced)
return z
z = project_data(X_reduce_mean, u, 100)
We next restore the data,The selection here is to keep only100個特征:
def recover_data(z, u, k):
u_reduced = u[:,:k]
X_recover=dot(z, u_reduced.T)
return X_recover
X_recover=recover_data(z,u,100)
Let's take a look at the image after the final dimension reduction:
plot_100_image(X_recover)
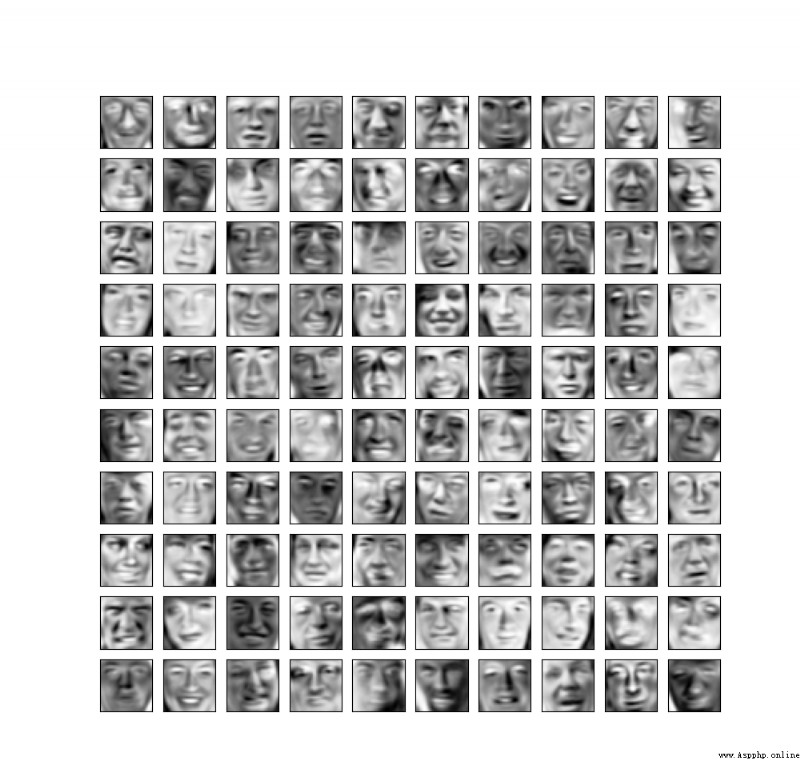
Let's compare two pictures,可以很明顯的看出,The second image retains fewer features,Has caused some blur on the face.
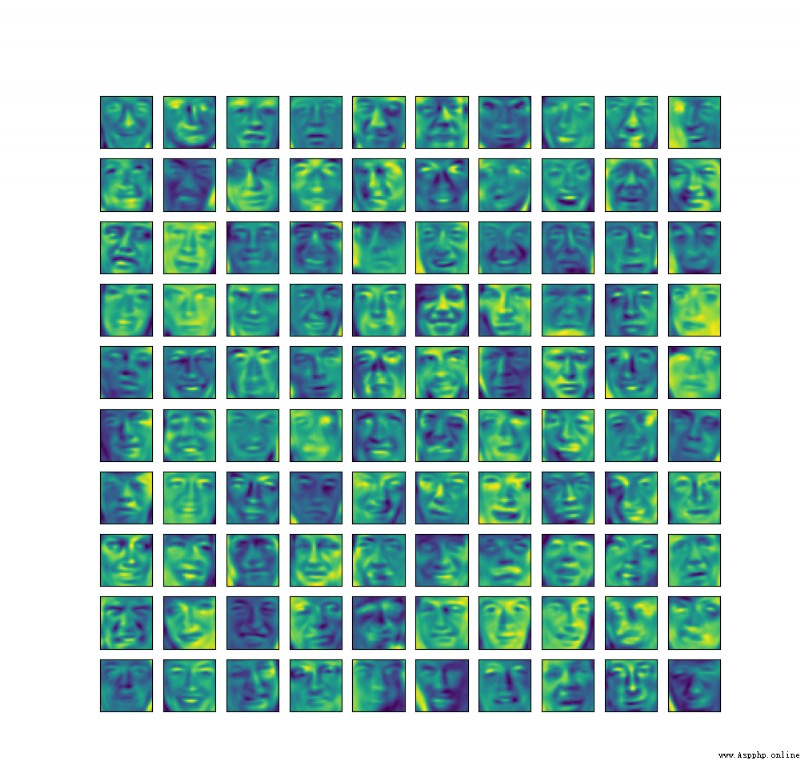
如果不設置 cmap='Greys_r' will be hell:
最開始的100張人臉: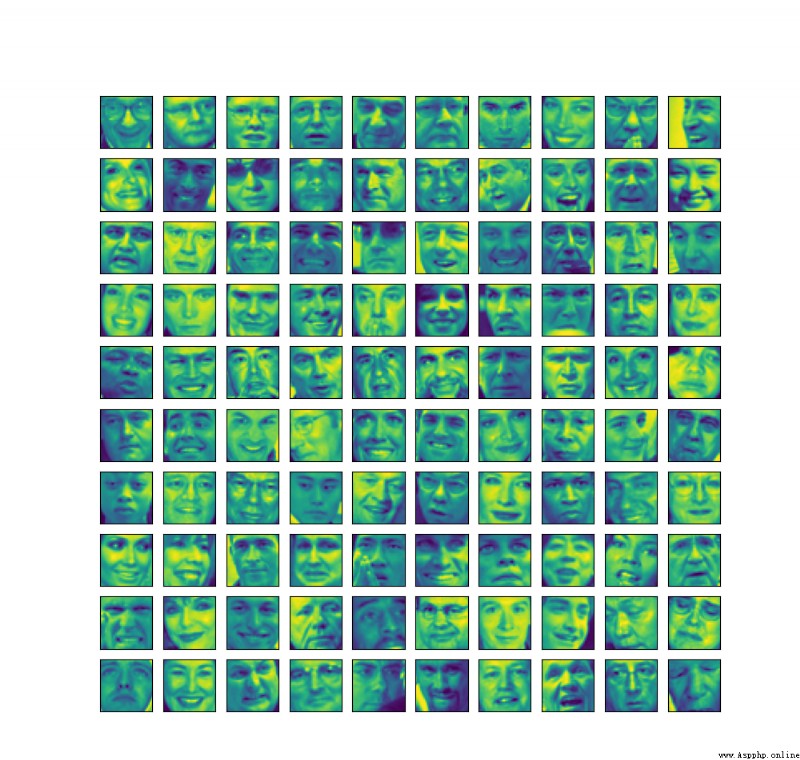
The face after dimensionality reduction: