Set scale has two methods:
ax.set_xticks()設置刻度 ,matplotlibPut corresponding calibration range which position,By default, the scale is the scale label;
ax.set_xticklabels(),Can be any other type of value as the label,Can be assigned to the already set beforeset_xtick.
We illustrated by example in:
代碼解釋
import matplotlib.pyplot as plt
from numpy import *
random.seed(20)
x=random.randint(0,100,50)
fig,ax=plt.subplots(figsize=(12,8))
ax.plot(x,'kx--')
plt.show()
At this point we generate results for: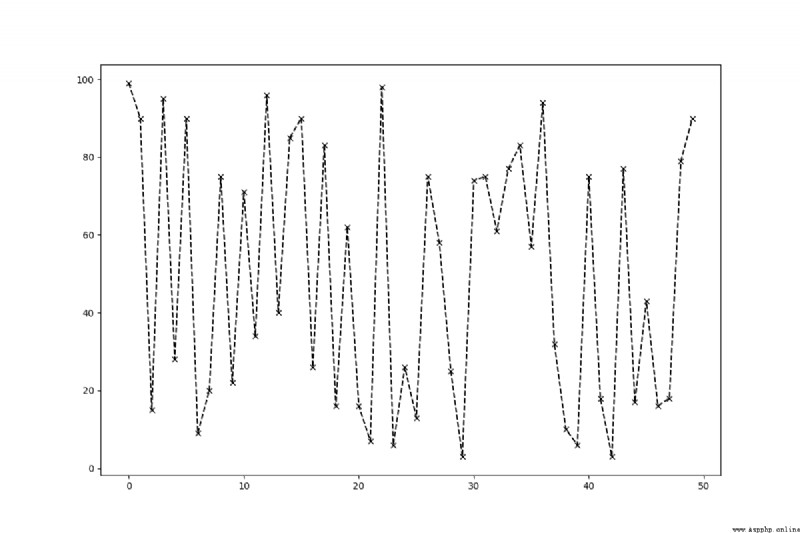
We add the code:
ticks = ax.set_xticks([0,20,40,60]) # 設置刻度
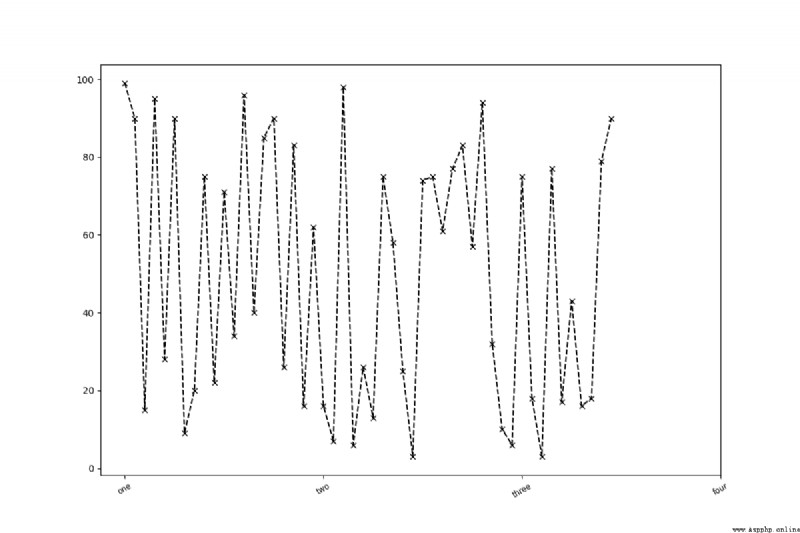
很明顯可以看出,We two pictureXAxis calibration has changed.
同樣的道理:
ticks = ax.set_xticks([0,20,40,60]) # 設置刻度
labels = ax.set_xticklabels(['one','two','three','four'],rotation = 30,fontsize = 'small') # 設置刻度標簽