問題描述
方法
0. plt.colorbar參數介紹
1. plt.colorbar(im, fraction=0.046, pad=0.04, shrink=1.0)
2. make_axes_locatable
3. make_axes_locatables 升級版
4. 手動給colorbar添加一個axe
總結
問題描述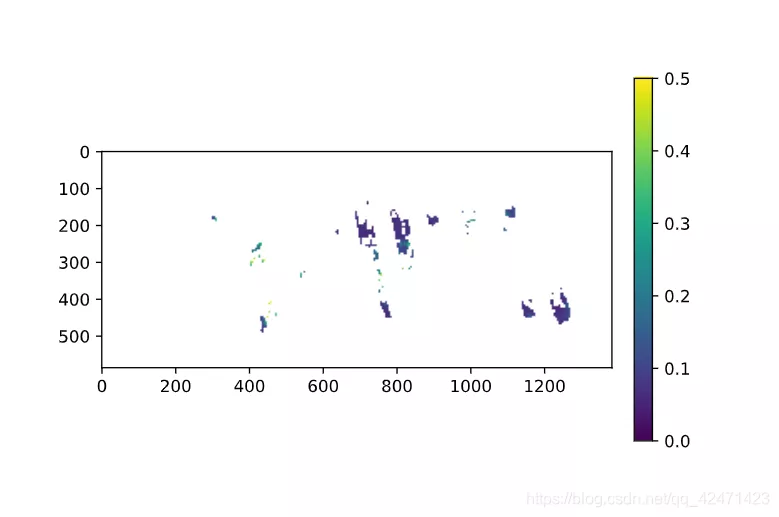
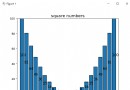
像這樣的圖,我想把右邊的colorbar設置成和主圖一樣高度
方法0. plt.colorbar參數介紹https://matplotlib.org/stable/api/_as_gen/matplotlib.pyplot.colorbar.html?highlight=colorbar#matplotlib.pyplot.colorbar
1. plt.colorbar(im, fraction=0.046, pad=0.04, shrink=1.0)fraction可以從0.035-0.046調節以找到合適大小
但當圖像的長、高對比過大時,可能不起作用
2. make_axes_locatable這是matplotlib包裡的一個函數
from mpl_toolkits.axes_grid1 import make_axes_locatableim = plt.imshow(data)divider = make_axes_locatable(plt.gca())cax = divider.append_axes("right", size="5%", pad="3%")plt.colorbar(im, cax=cax)不適用於有投影參數的axe(會報錯),如cartopy的GeoAxes
3. make_axes_locatables 升級版https://stackoverflow.com/questions/18195758/set-matplotlib-colorbar-size-to-match-graph @Matthias
import matplotlib.pyplot as pltfrom mpl_toolkits import axes_grid1def add_colorbar(im, aspect=20, pad_fraction=0.5, **kwargs): """Add a vertical color bar to an image plot.""" divider = axes_grid1.make_axes_locatable(im.axes) width = axes_grid1.axes_size.AxesY(im.axes, aspect=1./aspect) pad = axes_grid1.axes_size.Fraction(pad_fraction, width) current_ax = plt.gca() cax = divider.append_axes("right", size=width, pad=pad) plt.sca(current_ax) return im.axes.figure.colorbar(im, cax=cax, **kwargs)用法示例
im = plt.imshow(np.arange(200).reshape((20, 10)))add_colorbar(im)4. 手動給colorbar添加一個axehttps://stackoverflow.com/questions/18195758/set-matplotlib-colorbar-size-to-match-graph @Fei Yao
import matplotlib.pyplot as pltimport numpy as npfig=plt.figure()ax = plt.axes()im = ax.imshow(np.arange(100).reshape((10,10)))# Create an axes for colorbar. The position of the axes is calculated based on the position of ax.# You can change 0.01 to adjust the distance between the main image and the colorbar.# You can change 0.02 to adjust the width of the colorbar.# This practice is universal for both subplots and GeoAxes.cax = fig.add_axes([ax.get_position().x1+0.01,ax.get_position().y0,0.02,ax.get_position().height])plt.colorbar(im, cax=cax) # Similar to fig.colorbar(im, cax = cax)效果展示
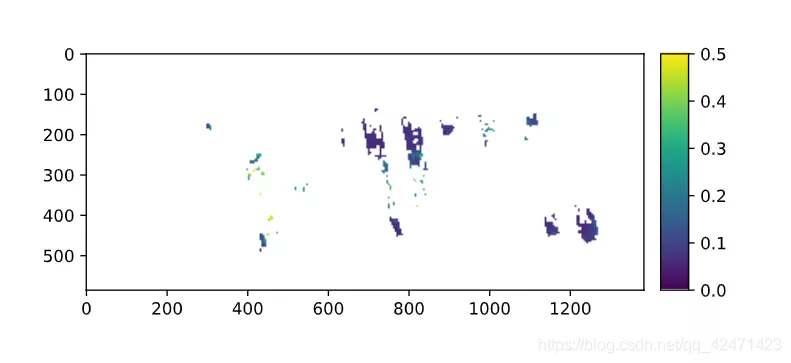
到此這篇關於如何使用Python修改matplotlib.pyplot.colorbar的位置以對齊主圖的文章就介紹到這了,更多相關Python修改matplotlib.pyplot.colorbar位置內容請搜索軟件開發網以前的文章或繼續浏覽下面的相關文章希望大家以後多多支持軟件開發網!