When writing test programs , Due to the large number of data frames , The generated curve is ugly , Here's the picture :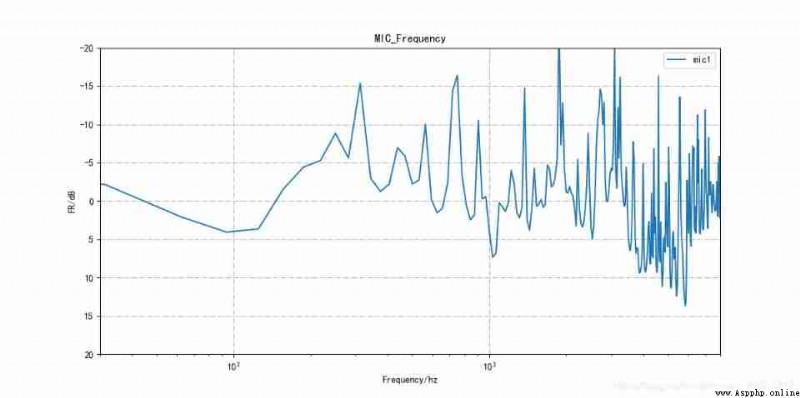
The high frequency curve is very ugly due to the fluctuation of some points in the high frequency , So we need to smooth the curve , Make the curve transition smoother . Smooth the curve , It is recommended to use Savitzky-Golay filter , Can be in scipy Library direct call , There is no need to define the function .
About Savitzky-Golay filter , Can be in scipy See the definition of this function in :
https://docs.scipy.org/doc/scipy/reference/generated/scipy.signal.savgol_filter.html
Savitzky-Golay Smoothing filtering is a common filtering method in spectral preprocessing , Its core idea is to analyze the data points in a certain length window k Polynomial fitting of order , So as to get the fitting result . After discretizing it ,S-G Filtering is actually a weighted average algorithm of moving window , But its weighting coefficient is not a simple constant window , But through the least square fitting of a given higher-order polynomial in the sliding window .
Savitzky-Golay Smoothing filter is widely used in data stream smoothing and denoising , It is a filtering method based on local polynomial least square fitting in time domain . The biggest feature of this filter is that it can ensure the shape of the signal while filtering out the noise 、 The width does not change .
When using a smoothing filter to filter a signal , In fact, it fits the low-frequency components in the signal , And smoothed out the high-frequency components . If the noise is at the high frequency , Then the result of filtering is to remove the noise , conversely , If the noise is in the low frequency band , Then the result of filtering is to leave noise .
All in all , Smoothing filtering is one of the commonly used preprocessing methods in spectral analysis . use Savitzky-Golay Method for smoothing filtering , It can improve the smoothness of the spectrum , Noise and reduce interference .S-G Effect of smooth filtering , It varies with the selected window width , It can meet the needs of many different occasions .
python in Savitzky-Golay The filter call is as follows :
tmp_smooth = scipy.signal.savgol_filter(tmp,53,3)
among , stay scipy Explanation ,
scipy.signal.savgol_filter(x, window_length, polyorder, deriv=0, delta=1.0, axis=-1, mode=‘interp’, cval=0.0)[source]
Apply a Savitzky-Golay filter to an array.
This is a 1-d filter. If x has dimension greater than 1, axis determines the axis along which the filter is applied.
Parameters
xarray_like
The data to be filtered. If x is not a single or double precision floating point array, it will be converted to type numpy.float64 before filtering.
window_length:int
The length of the filter window (i.e. the number of coefficients). window_length must be a positive odd integer. If mode is ‘interp’, window_length must be less than or equal to the size of x.
polyorder:int
The order of the polynomial used to fit the samples. polyorder must be less than window_length.
x For raw data , That is... In my code above tmp data .window_length Is the window length , The value needs to be a positive odd integer .polyorder To the data points in the window k Polynomial fitting of order ,k The value of needs to be less than window_length.
Now take a look window_length and k The influence of these two values on the curve .
First of all window_length Smoothing effect on curve , The code is as follows :
tmp_smooth1 = scipy.signal.savgol_filter(tmp,21,3)
tmp_smooth2 = scipy.signal.savgol_filter(tmp,53,3)
plt.semilogx(f,tmp*0.5,label = 'mic'+str(num+1))
plt.semilogx(f,tmp_smooth1*0.5,label = 'mic'+str(num+1)+' Fit the curve -21',color = 'red')
plt.semilogx(f,tmp_smooth2*0.5,label = 'mic'+str(num+1)+' Fit the curve -53',color = 'green')
The generated curve is as follows :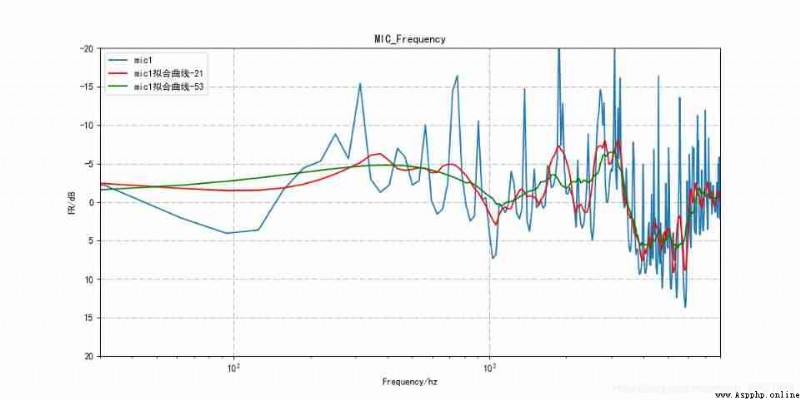
You can see ,window_length The smaller the value of , The closer the curve is to the real curve ;window_length The bigger the value is. , The smoother the effect .
Look again k The effect of values on the curve , The code is as follows :
tmp_smooth1 = scipy.signal.savgol_filter(tmp,53,3)
tmp_smooth2 = scipy.signal.savgol_filter(tmp,53,9)
plt.semilogx(f,tmp*0.5,label = 'mic'+str(num+1))
plt.semilogx(f,tmp_smooth1*0.5,label = 'mic'+str(num+1)+' Fit the curve -P3',color = 'red')
plt.semilogx(f,tmp_smooth2*0.5,label = 'mic'+str(num+1)+' Fit the curve -P9',color = 'green')
The generated curve is as follows :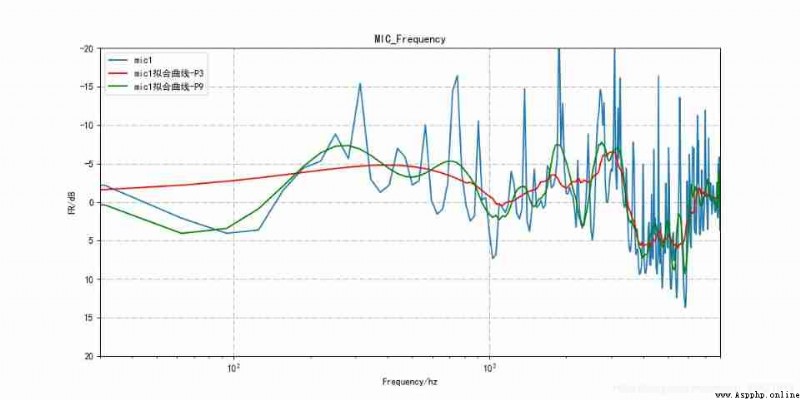
You can see ,k The bigger the value is. , The closer the curve is to the real curve ;k The smaller the value. , The smoother the curve . in addition , When k When it's worth more , Limited by window length , Fitting will have problems , The high frequency curve will become a straight line , As shown in the figure below :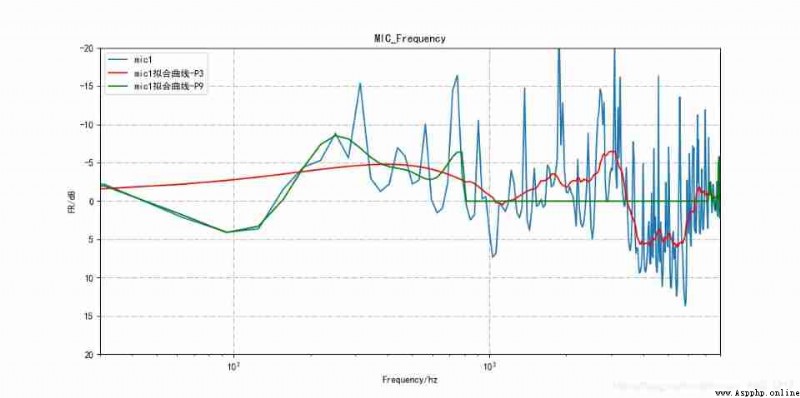
Finally, the fitting effect obtained by adjusting the threshold is as follows :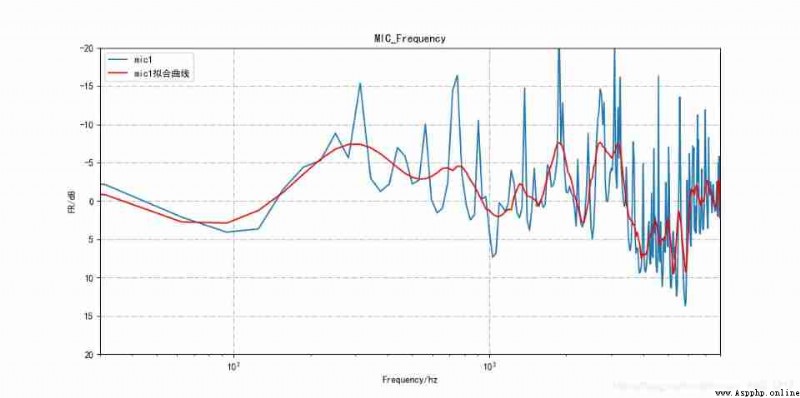
Savitzky-Golay Smooth filtering python Realization