Catalog
1 summary
2 The goal is
3 python Code implementation
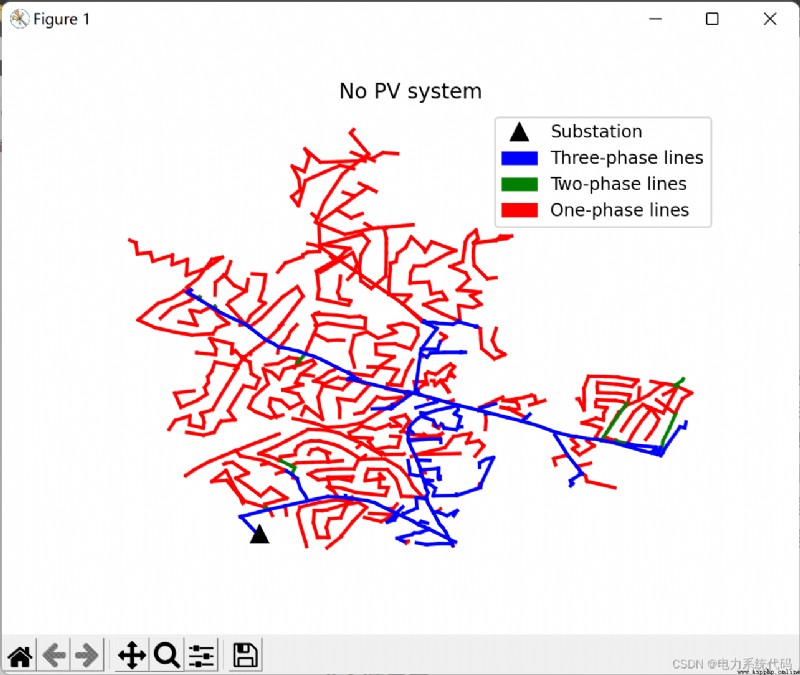
3.1 Result display
3.2 python Code
Human beings rely more and more on electricity in their daily life , Using equipment that requires electricity is no longer a luxury , But become a necessity . The parties responsible for providing such resources to the public must deal with the production of electricity 、 Transmission and distribution problems . Although much progress has been made in power system protection in the past decades , But there is still much room to improve the continuity of energy supply services . In the context of power distribution , Take Brazil for example , The power supply quality of consumers can be quantified by the continuity index of distribution service . State Electricity administration (Aneel) stay [PRODIST 2012] Two of these indicators are provided in , I.e. equivalent interruption duration per power consumption unit (DEC) And the equivalent interruption frequency of each power consumption unit (FEC). DEC Through the calculation period , The time interval obtained from the average value of power distribution service interruption of the relevant power user . FEC Is the average frequency at which this discontinuity occurs in the unit under consideration .
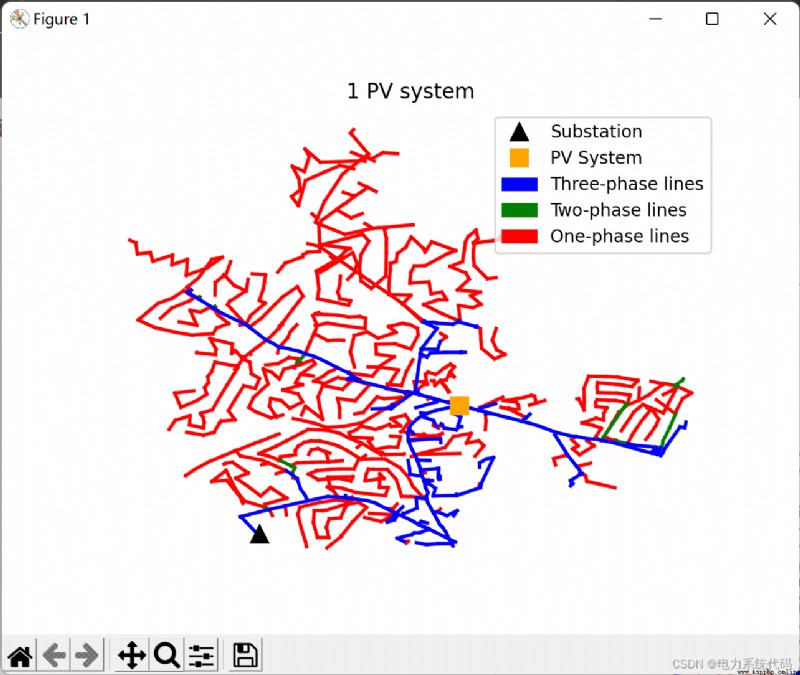
This paper aims to determine the impact of distributed photovoltaic power generation on fault location of radial distribution network . The size of the PV system depends on the penetration limit of the circuit . stay OpenDSS Perform fault simulation on , To obtain the voltage and current values of the substation . These results are recorded in the database and used to train the neural network of multilayer perceptron class , The network is able to 90% The average success rate determines whether distributed photovoltaic power generation exists or not in the circuit 6 Fault location between possible geographical areas .
MLP It is a kind of neural network with layered work . The input layer receives the problem input , The middle hidden layer performs mapping operations , The output layer provides output , Pictured 1.1 Shown . The basic layer units that simulate neurons are called perceptrons . Except for the perceptron , The input layer and the middle layer also have an offset node , Used for processing equal to 0 The input of .
Supplement , be based on [Goodfellow et al. 2016],MLP It's just a function y = f(x; θ), It uses optimized θ Parameters will be entered x Map to output y. so to speak , according to [Géron 2017] A Book , The working principle of the perceptron is to sum its input with weight , And discretize the value of the sum according to its symbol , Like the equation Shown 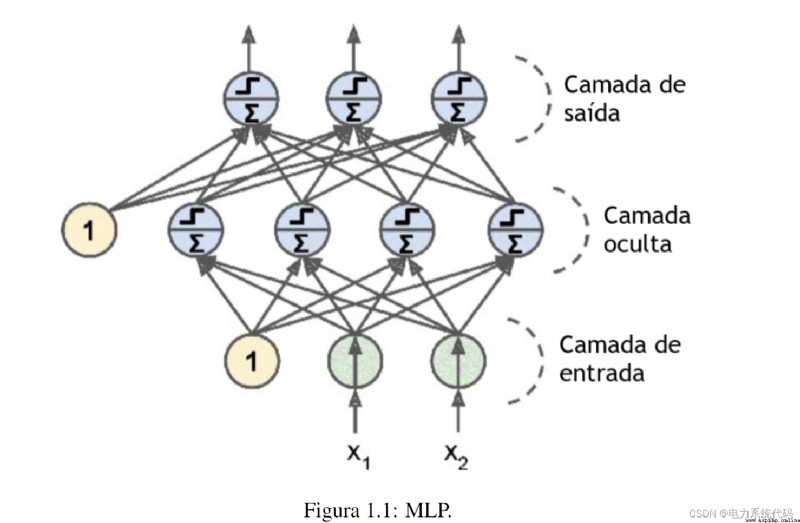
Supplement ,MLP It's just a function y = f(x; θ), It uses optimized θ Parameters will be entered x Map to output y. so to speak , The working principle of the perceptron is to sum its input with weight , And discretize the value of the sum according to its symbol , Like the equation Shown :
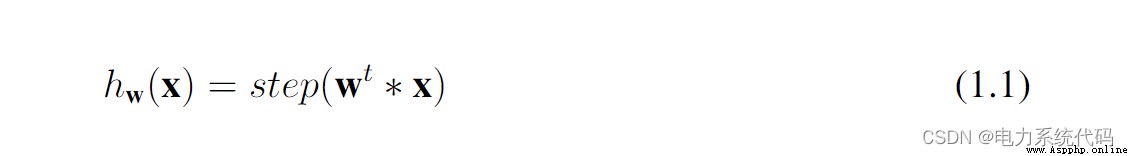
among hw Is the output of the perceptron ,x Is the input value ,w Is the weight assigned to each input ,step Is a discrete function of the sum value , It can be Heaviside Function or signal function .
adjustment MLP One of the methods of weighting is through back propagation technology . The mechanism includes , After determining the forward weight of the neural network and its total error , The error contribution of each weight is inversely calculated , A new weight with small total error in each iteration is proposed . In order to make this method feasible , Activation function , That is, the step function in the traditional perceptron structure , Must be replaced by a smoothing function , For example, logical functions 、 Hyperbolic tangent function or rectified linear unit function (ReLU ), As shown in the equation :
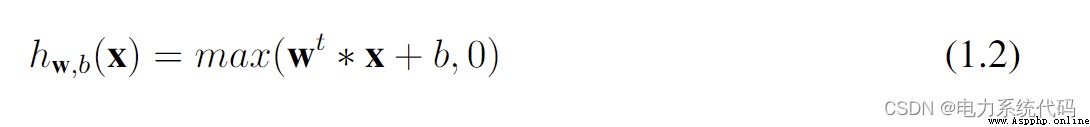
among hw,b(x) yes ReLU function ,b It's the deviation value . Besides , By calculating the function gradient, the back-propagation method can be optimized by using the random gradient descent .
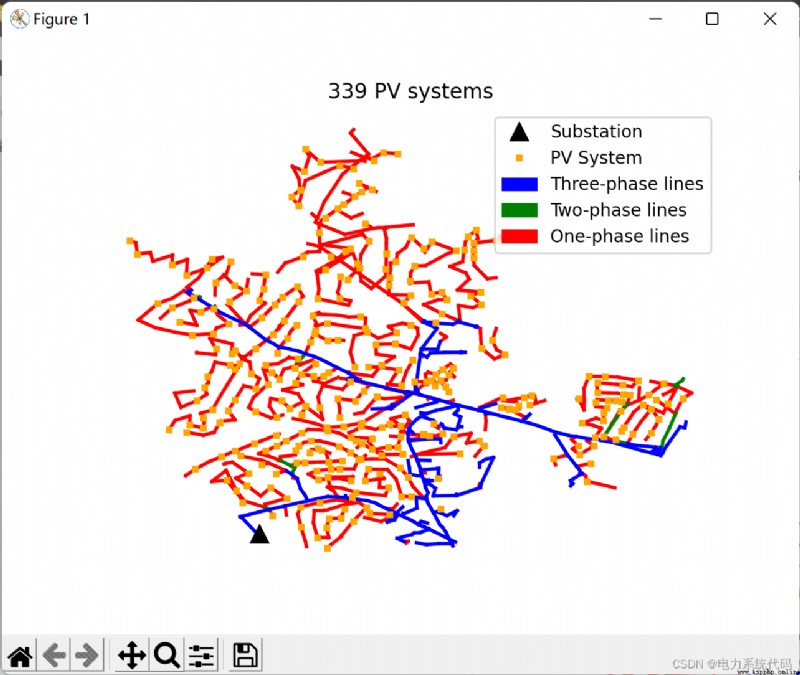
This paper aims to determine the impact of distributed photovoltaic power generation on fault location of radial distribution network . The size of the PV system depends on the penetration limit of the circuit . stay OpenDSS Perform fault simulation on , To obtain the voltage and current values of the substation . These results are recorded in the database and used to train the neural network of multilayer perceptron class , The network is able to 90% The average success rate determines whether distributed photovoltaic power generation exists or not in the circuit 6 Fault location between possible geographical areas . The overall objective is to verify GDFV Influence in fault location of distribution system . The secondary goals that support the primary goals are : Design different PV systems for distribution feeders under their penetration limits , And evaluate its power flow ; Simulate the fault of all buses of distribution feeder at different points of load curve . The implementation can detect faults and classify them into types 、 Algorithm of resistance and geographical location .
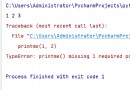
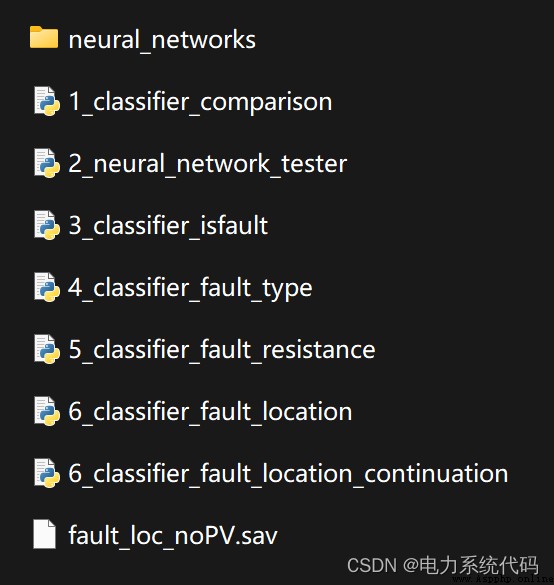
This article only shows part of the code , All code points here : We are shipping your work details
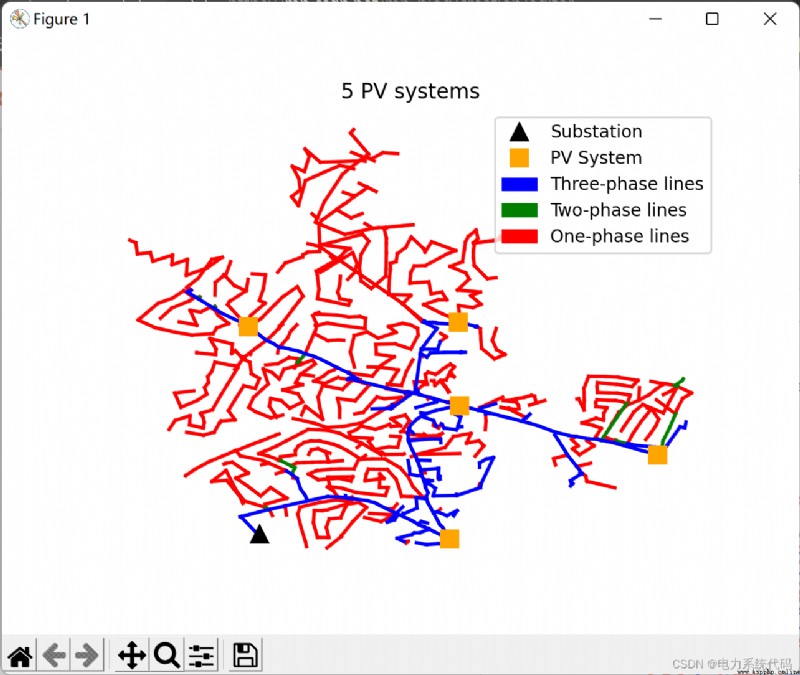
def plot_5_pv():
ckt24_plot()
substation, = pylab.plot([11735514.42],[3709460.816],'k^',
markersize=10, label='Substation')
pvsyst, = pylab.plot(
[11740361.09,11745683.27,11740622.95,11740594.66,11735219.81],
[3709237.782,3712746.259,3714771.12,3718243.191,3718067.52],
color='orange', marker='s', markersize=10, linestyle='None',
label='PV System')
blue_patch = mpatches.Patch(color='blue', label='Three-phase lines')
green_patch = mpatches.Patch(color='green', label='Two-phase lines')
red_patch = mpatches.Patch(color='red', label='One-phase lines')
pylab.legend(handles=[substation, pvsyst, blue_patch, green_patch,
red_patch])
pylab.title("5 PV systems")
pylab.show()