示例代碼
import matplotlib.pyplot as plt
import numpy as np
obs_x_data = [20.61782455, 20.3446064, 20.33182907, 20.41394997, 20.42613411, 20.38294792, 20.29493904, 20.11700439, 19.44220352, 17.69989204,
16.50032616, 15.84687519, 14.43702602, 12.91092873, 11.64278507, 11.01664066, 10.34288025, 9.60017872, 8.91129875, 8.14001083]
obs_y_data = [30.85092926, 30.41317368, 30.22782707, 29.81970787, 29.28694534, 29.19682884, 29.06859398, 29.03396034, 29.01906776, 29.49583817,
29.87446022, 30.07171631, 30.44148064, 30.78217125, 31.01222801, 31.08432961, 31.16893959, 31.26436996, 31.36372185, 31.45003319]
pred_x_data = [20.61782455, 20.3446064, 20.33182907, 20.41394997, 20.42613411, 20.38294792, 20.29493904, 20.11700439, 19.44220352, 17.69989204,
16.50027275, 15.39491463, 14.33294296, 13.27159023, 12.1923933, 11.0963583, 10.00212288, 8.92199039, 7.85391903, 6.7955761]
pred_y_data = [30.85092926, 30.41317368, 30.22782707, 29.81970787, 29.28694534, 29.19682884, 29.06859398, 29.03396034, 29.01906776, 29.49583817,
29.87576103, 30.21777916, 30.55349922, 30.88473892, 31.22133636, 31.54788208, 31.86850739, 32.18684769, 32.4966507, 32.79633331]
plt.figure(figsize=(12, 7.5))
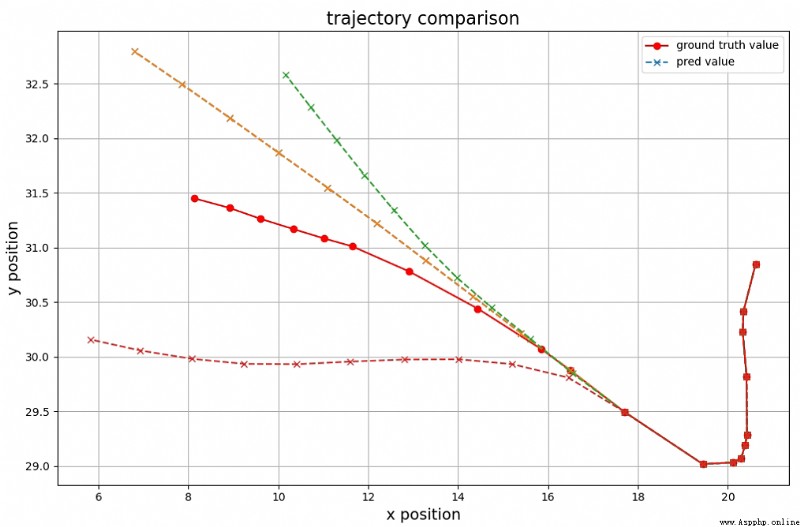
plt.plot(obs_x_data, obs_y_data, 'ro', linestyle='solid', label='ground truth')
plt.plot(pred_x_data, pred_y_data, 'bx', linestyle='dashed', label='pred value')
plt.xlim(5, 22)
plt.ylim(28, 34)
x_ticks = np.arange(5, 22, 1)
y_ticks = np.arange(28, 34, 0.5)
plt.xticks(x_ticks)
plt.yticks(y_ticks)
plt.ylabel('y position', fontsize=14)
plt.xlabel('x position', fontsize=14)
plt.legend(loc='upper right', ncol=1, fancybox=True, shadow=True)
plt.title("trajectory comparison", fontsize=16)
plt.legend() # 顯示圖例
plt.grid(True) # 顯示網格線
plt.show() # 顯示圖片
如果想保存圖片
...
plt.savefig('/your/path/test.png') # 將圖片數據寫入文件
plt.show() # 將圖片數據發送到用戶界面庫以進行顯示
如果想畫多張圖片:比如多個目標多條軌跡
for target in range(len(targets)):
for index in range(len(trajectories)):
plt.figure(figsize=(12, 7.5))
...
plt.plot()
...
plt.show() # 注意在for循環外,for循環畫多張圖,循環結束後顯示多張圖片
如果想給圖片設置不同編號和像素
for target in range(len(targets)):
for index in range(len(trajectories)):
plt.figure(figsize=(12, 7.5))
...
plt.plot()
...
# 設置不同圖片編號和像素
plt.savefig('your/path/test_{}.png'.format(index), dpi = 200)
plt.show()
matplotlib默認像素值是100,即如果輸出8 x 6空間單位的圖,那麼就能提供8*100 x 6*100像素的圖片文件
參考文章:
matplotlib可視化
matplotlib存儲多張圖片
savefig()函數的參數使用
created by shuaixio, 2022.06.19