introduction
1、sobel operator
2、roberts operator
3、scharr operator
4、prewitt operator
5、canny operator
6、gabor wave filtering
7、gaussian wave filtering
8、median
9、 level 、 Vertical edge detection
10、 Cross edge detection
introductionFilter the image , It can have two effects : One is smooth filtering , Used to suppress noise ; The other is differential operator , It can be used for edge detection and feature extraction .
skimage Pass through the library filters The module performs filtering operation .
1、sobel operatorsobel Operators can be used to detect edges
The function format is :skimage.filters.sobel(image, mask=None)
from skimage import data,filtersimport matplotlib.pyplot as pltimg = data.camera()edges = filters.sobel(img)plt.imshow(edges,plt.cm.gray)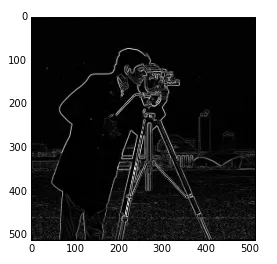
roberts Operator and sobel Like operators , Used to detect edges
The call format is the same :
edges = filters.roberts(img)3、scharr operator Same function sobel, Invocation format :
edges = filters.scharr(img)4、prewitt operator Same function sobel, Invocation format :
edges = filters.prewitt(img)5、canny operator canny Operators are also used to extract edge features , But it's not on filters modular , It's on the feature modular
Function format :skimage.feature.canny(image,sigma=1.0)
You can modify sigma To adjust the effect
from skimage import data,filters,featureimport matplotlib.pyplot as pltimg = data.camera()edges1 = feature.canny(img) #sigma=1edges2 = feature.canny(img,sigma=3) #sigma=3plt.figure('canny',figsize=(8,8))plt.subplot(121)plt.imshow(edges1,plt.cm.gray) plt.subplot(122)plt.imshow(edges2,plt.cm.gray)plt.show()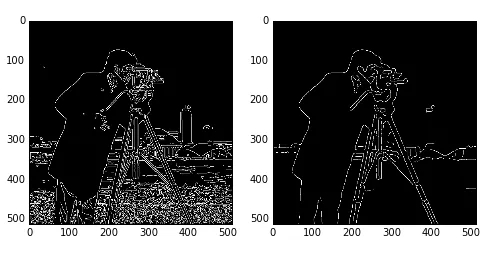
It can be seen from the results ,sigma The smaller it is , The smaller the edge lines .
6、gabor wave filteringgabor Filtering can be used for edge detection and texture feature extraction .
Function call format :skimage.filters.gabor_filter(image, frequency)
By modifying the frequency Value to adjust the filtering effect , Returns a pair of edge results , One is to use the filtering result of the real filtering kernel , One is the filtering result of the imaginary filtering kernel .
from skimage import data,filtersimport matplotlib.pyplot as pltimg = data.camera()filt_real, filt_imag = filters.gabor_filter(img,frequency=0.6) plt.figure('gabor',figsize=(8,8))plt.subplot(121)plt.title('filt_real')plt.imshow(filt_real,plt.cm.gray) plt.subplot(122)plt.title('filt-imag')plt.imshow(filt_imag,plt.cm.gray)plt.show()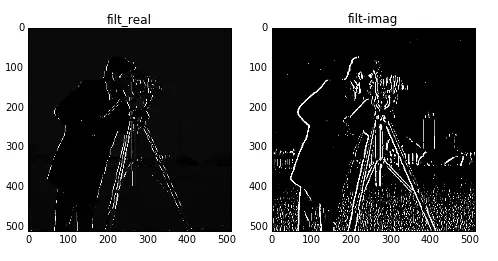
The above is frequency=0.6 Results of .
The above is frequency=0.1 Results of
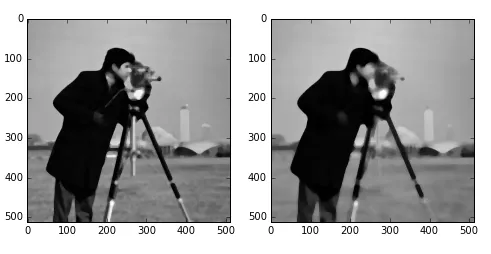
7、gaussian wave filteringMultidimensional filter , It is a kind of smoothing filter , Can eliminate Gaussian noise .
The call function is :skimage.filters.gaussian_filter(image, sigma)
By adjusting the sigma To adjust the filtering effect
from skimage import data,filtersimport matplotlib.pyplot as pltimg = data.astronaut()edges1 = filters.gaussian_filter(img,sigma=0.4) #sigma=0.4edges2 = filters.gaussian_filter(img,sigma=5) #sigma=5plt.figure('gaussian',figsize=(8,8))plt.subplot(121)plt.imshow(edges1,plt.cm.gray) plt.subplot(122)plt.imshow(edges2,plt.cm.gray)plt.show()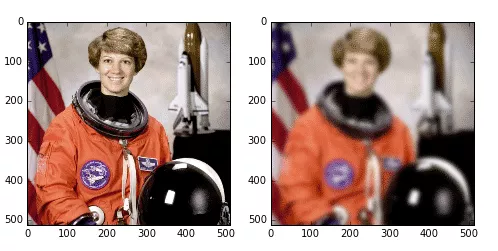
so sigma The bigger it is , The more blurred the filtered image
8、medianmedian filtering , A smoothing filter , Noise can be eliminated .
Need to use skimage.morphology Module to set the shape of the filter .
from skimage import data,filtersimport matplotlib.pyplot as pltfrom skimage.morphology import diskimg = data.camera()edges1 = filters.median(img,disk(5))edges2= filters.median(img,disk(9))plt.figure('median',figsize=(8,8))plt.subplot(121)plt.imshow(edges1,plt.cm.gray) plt.subplot(122)plt.imshow(edges2,plt.cm.gray)plt.show()
It can be seen from the results , The larger the filter , The more blurred the image .
9、 level 、 Vertical edge detectionThe above examples are all edge detection , Sometimes we just need to detect horizontal edges , Or vertical edge , You can use the following method .
Horizontal edge detection :sobel_h, prewitt_h, scharr_h
Vertical edge detection : sobel_v, prewitt_v, scharr_v
from skimage import data,filtersimport matplotlib.pyplot as pltimg = data.camera()edges1 = filters.sobel_h(img) edges2 = filters.sobel_v(img) plt.figure('sobel_v_h',figsize=(8,8))plt.subplot(121)plt.imshow(edges1,plt.cm.gray) plt.subplot(122)plt.imshow(edges2,plt.cm.gray)plt.show()
The upper left figure shows the detected horizontal edge , The right figure shows the detected vertical edge .
10、 Cross edge detectionYou can use Roberts The cross core of , To achieve the purpose of detecting the cross edge . These cross edges are actually a component of the gradient in one direction .
One of the nuclei :
0 1
-1 0
Corresponding function :
roberts_neg_diag(image)
example :
from skimage import data,filtersimport matplotlib.pyplot as pltimg =data.camera()dst =filters.roberts_neg_diag(img) plt.figure('filters',figsize=(8,8))plt.subplot(121)plt.title('origin image')plt.imshow(img,plt.cm.gray)plt.subplot(122)plt.title('filted image')plt.imshow(dst,plt.cm.gray)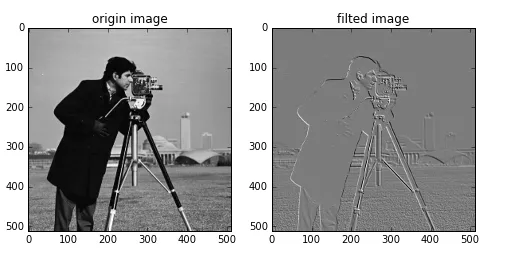
Another core :
1 0
0 -1
The corresponding function is :
roberts_pos_diag(image)
from skimage import data,filtersimport matplotlib.pyplot as pltimg =data.camera()dst =filters.roberts_pos_diag(img) plt.figure('filters',figsize=(8,8))plt.subplot(121)plt.title('origin image')plt.imshow(img,plt.cm.gray)plt.subplot(122)plt.title('filted image')plt.imshow(dst,plt.cm.gray)
That's all python Digital image processing of the image simple filter implementation details , More about python For information on simple filtering of digital image processing, please pay attention to other relevant articles on the software development network !