Text
One 、 use figure Functions and subplot Function to create the main window and the sub graph respectively
Two 、 use subplots To create display windows and partition subgraphs
3、 ... and 、 Other methods of drawing and displaying
TextIn fact, we have already used image rendering , Such as :
io.imshow(img)
The essence of this line of code is to use matplotlib Package to draw pictures , After drawing successfully , Return to one matplotlib Data of type . therefore , We can also write :
import matplotlib.pyplot as pltplt.imshow(img)imshow() The function format is :
matplotlib.pyplot.imshow(X, cmap=None)
X: The image or array to draw .
cmap: Color map (colormap), The default is to draw RGB(A) Color space .
Other optional color maps are listed below :
Color map description autumn red - orange - yellow bone black - white ,x Line cool green - Magenta copper black - copper flag red - white - blue - black gray black - white hot black - red - yellow - white hsvhsv Color space , red - yellow - green - green - blue - Magenta - red inferno black - red - yellow jet blue - green - yellow - red magma black - red - white pink black - powder - white plasma green - red - yellow prism red - yellow - green - blue - purple -...- Green mode spring Magenta - yellow summer green - yellow viridis blue - green - yellow winter blue - greenThere are a lot of gray,jet etc. , Such as :
plt.imshow(image,plt.cm.gray)plt.imshow(img,cmap=plt.cm.jet)After drawing the picture on the window , Return to one AxesImage object . To display this object in the window , We can call show() Function to display , But when practicing (ipython Environment ), Generally we can omit show() function , It can also be displayed automatically .
from skimage import io,dataimg=data.astronaut()dst=io.imshow(img)print(type(dst))io.show()Is shown as :
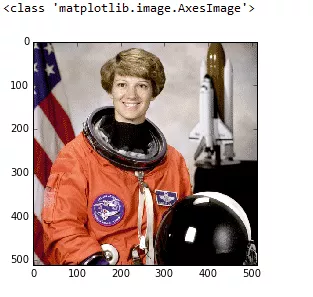
You can see , The type is 'matplotlib.image.AxesImage'. Show a picture , We usually prefer to write :
import matplotlib.pyplot as pltfrom skimage import io,dataimg=data.astronaut()plt.imshow(img)plt.show()matplotlib It's a professional drawing library , amount to matlab Medium plot, You can set multiple figure window , Set up figure The title of the , Hide the ruler , You can even use subplot In a figure Show multiple pictures in . Generally, we can import matplotlib library :
import matplotlib.pyplot as pltin other words , We actually draw with matplotlib Bag pyplot modular .
One 、 use figure Functions and subplot Function to create the main window and the sub graph respectivelyexample : Separate and display three channels of astronaut pictures at the same time
from skimage import dataimport matplotlib.pyplot as pltimg=data.astronaut()plt.figure(num='astronaut',figsize=(8,8)) # Create a file called astronaut The window of , And set the size plt.subplot(2,2,1) # Divide the window into two rows, two columns and four subgraphs , Four pictures can be displayed plt.title('origin image') # The title of the first picture plt.imshow(img) # Draw the first picture plt.subplot(2,2,2) # Second subgraph plt.title('R channel') # Title of the second picture plt.imshow(img[:,:,0],plt.cm.gray) # Draw the second picture , And it is a grayscale image plt.axis('off') # Do not show coordinate dimensions plt.subplot(2,2,3) # Third subgraph plt.title('G channel') # Title of the third picture plt.imshow(img[:,:,1],plt.cm.gray) # Draw the third picture , And it is a grayscale image plt.axis('off') # Do not show coordinate dimensions plt.subplot(2,2,4) # Fourth subgraph plt.title('B channel') # Title of the fourth picture plt.imshow(img[:,:,2],plt.cm.gray) # Draw the fourth picture , And it is a grayscale image plt.axis('off') # Do not show coordinate dimensions plt.show() # Display window 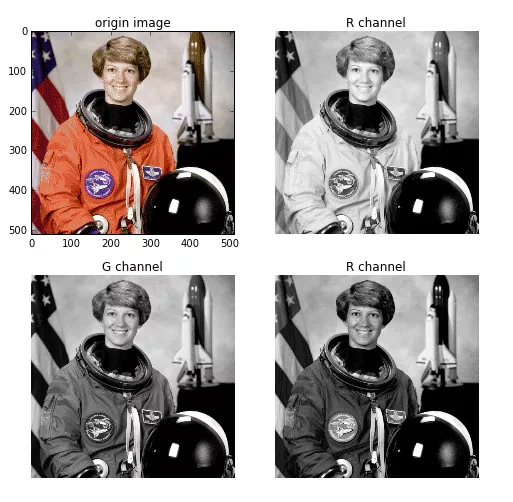
In the process of drawing pictures , We use it matplotlib.pyplot Under the module of figure() Function to create a display window , The format of this function is :
matplotlib.pyplot.figure(num=None, figsize=None, dpi=None, facecolor=None, edgecolor=None)
All parameters are optional , All have default values , Therefore, this function can be called without any parameters , among :
num: Integer or character type is OK . If set to integer , The integer number represents the sequence number of the window . If it is set to character type , The string represents the name of the window . Use this parameter to name the window , If two windows have the same serial number or name , Then the next window will overwrite the previous window .
figsize: Set window size . It's a tuple Integer of type , Such as figsize=(8,8)
dpi: Plastic figure , Represents the resolution of the window .
facecolor: The background color of the window .
edgecolor: Window border color .
use figure() Function to create a window , Only one picture can be displayed , If you want to display multiple pictures , You need to divide this window into several subgraphs , Show different pictures in each sub graph . We can use subplot() Function to partition subgraphs , The function format is :
matplotlib.pyplot.subplot(nrows, ncols, plot_number)
nrows: Row number of subgraphs .
ncols: Number of columns in a subgraph .
plot_number: The number of the current subgraph .
Such as :
plt.subplot(2,2,1)Will be figure The window is divided into 2 That's ok 2 Columns were 4 Subtext , The present is the 1 Subtext . Sometimes we can use this kind of writing :
plt.subplot(221)The two writing methods have the same effect . The title of each subgraph is available title() Function to set , Whether to use coordinate ruler is available axis() Function to set , Such as :
plt.subplot(221)plt.title("first subwindow")plt.axis('off') Two 、 use subplots To create display windows and partition subgraphs In addition to the above method, create the display window and divide the subgraph , There is another way to write it , Here's an example :
import matplotlib.pyplot as pltfrom skimage import data,colorimg = data.immunohistochemistry()hsv = color.rgb2hsv(img)fig, axes = plt.subplots(2, 2, figsize=(7, 6))ax0, ax1, ax2, ax3 = axes.ravel()ax0.imshow(img)ax0.set_title("Original image")ax1.imshow(hsv[:, :, 0], cmap=plt.cm.gray)ax1.set_title("H")ax2.imshow(hsv[:, :, 1], cmap=plt.cm.gray)ax2.set_title("S")ax3.imshow(hsv[:, :, 2], cmap=plt.cm.gray)ax3.set_title("V")for ax in axes.ravel(): ax.axis('off')fig.tight_layout() # Automatic adjustment subplot Parameters between 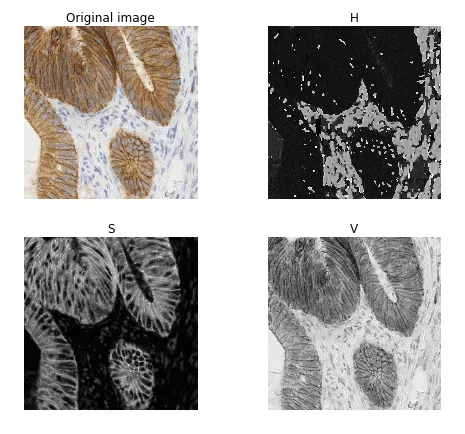
Direct use subplots() Function to create and divide windows . Be careful , It's better than the front subplot() One more function s, The format of this function is :
matplotlib.pyplot.subplots(nrows=1, ncols=1)
nrows: Number of rows of all subgraphs , The default is 1.
ncols: The number of all subgraphs , The default is 1.
Return to a window figure, And a tuple Type ax object , This object contains all the subgraphs , Can be combined with ravel() Function to list all subgraphs , Such as :
fig, axes = plt.subplots(2, 2, figsize=(7, 6))ax0, ax1, ax2, ax3 = axes.ravel()Created 2 That's ok 2 Column 4 Subtext , They are called ax0,ax1,ax2 and ax3, The title of each subgraph is set_title() Function to set , Such as :
ax0.imshow(img)ax0.set_title("Original image")If there are multiple subgraphs , We can also use tight_layout() Function to adjust the layout of the display , The format of this function is :
matplotlib.pyplot.tight_layout(pad=1.08, h_pad=None, w_pad=None, rect=None)
All parameters are optional , All parameters can be omitted when calling this function .
pad: The distance between the edge of the main window and the edge of the subgraph , The default is 1.08
h_pad, w_pad: The distance between the edges of a subgraph , The default is pad_inches
rect: A rectangular area , If you set this value , Adjust all subgraphs to this rectangular area .
General call is :
plt.tight_layout() # Automatic adjustment subplot Parameters between 3、 ... and 、 Other methods of drawing and displaying Besides using matplotlib Library to draw pictures ,skimage There is another sub module viewer, A function is also provided to display the image . The difference is , It USES Qt Tool to create a canvas , To draw an image on the canvas .
example :
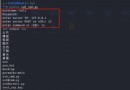
from skimage import datafrom skimage.viewer import ImageViewerimg = data.coins()viewer = ImageViewer(img)viewer.show()So to conclude , The functions commonly used to draw and display pictures are :
Function name function Invocation format figure Create a display window plt.figure(num=1,figsize=(8,8)imshow Drawing pictures plt.imshow(image)show Display window plt.show()subplot Divide the subgraphs plt.subplot(2,2,1)title Set the sub graph title ( And subplot Use a combination of )plt.title('origin image')axis Whether to display the coordinate ruler plt.axis('off')subplots Create a window with multiple subgraphs fig,axes=plt.subplots(2,2,figsize=(8,8))ravel Set variables for each subgraph ax0,ax1,ax2,ax3=axes.ravel()set_title Set the sub graph title ( And axes Use a combination of )ax0.set_title('first window')tight_layout Automatically adjust the sub graph display layout plt.tight_layout()That's all python Digital image processing image rendering details , More about python For the data of digital image processing and drawing, please pay attention to other relevant articles on the software development network !
 [Python app automation test practice part ⑥] - Practice - appium common element location methods for locating mobile phone elements
Wanyeji Faint thunder , Cloud
 Note: overview of user-defined use process of Django rest framework apiview certification class
Validation classes can be used