【 Introduction 】:Memray Is a can check Python Code memory allocation tools , We can use it to Python The code in the interpreter or extension module , And generate a variety of statistical reports , Thus, you can see the memory allocation of the code more intuitively .
Developers can , Generate a variety of statistical reports , Observe the memory allocation of the program .
Summary report
This report will display the memory allocation of multiple threads in the same table ,own memory Represents the memory occupied by each function ,total memory Indicates the total amount of memory occupied by the function itself and other functions it calls ,allocation count Indicates the number of temporarily unreleased memory .
Flame diagram Report
This report can visualize the memory allocation data . The first layer of the flame diagram is the function that occupies memory , The wider it is , The more memory it takes ; The functions of each layer are called by the functions of the next layer , By analogy .
Sample code :
def a(n):
    return b(n)
def b(n):
    return [c(n), d(n)]
def c(n):
    return "a" * n
def d(n):
    return "a" * n
a(100000)
Generated flame chart

It can be seen from the figure that , function a I called the function b, function b I called the function c And the function d. And the first layer function c And the function d Occupy the same width , Express c and d It takes up the same amount of memory .
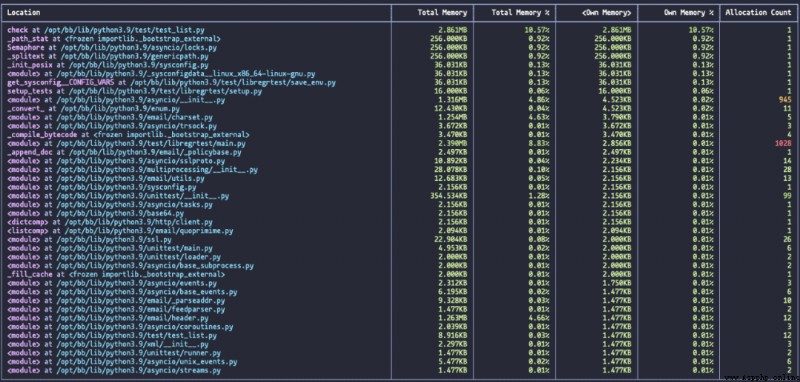
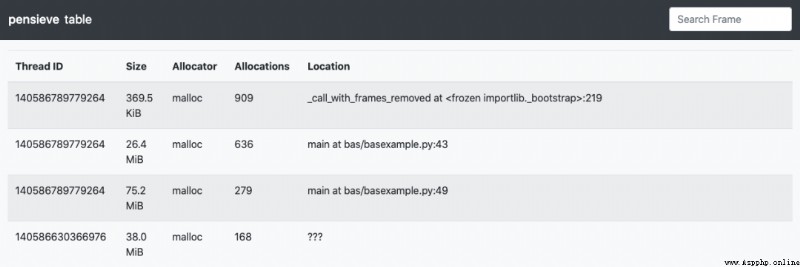
Form report
The report shows the memory usage of the program in the form of a table .Thread ID Indicates the corresponding thread ,Size Indicates the total amount of memory used ,Allocator Represents functions that occupy memory ,Location Indicates where the function is located . meanwhile , You can also sort the data in each column .
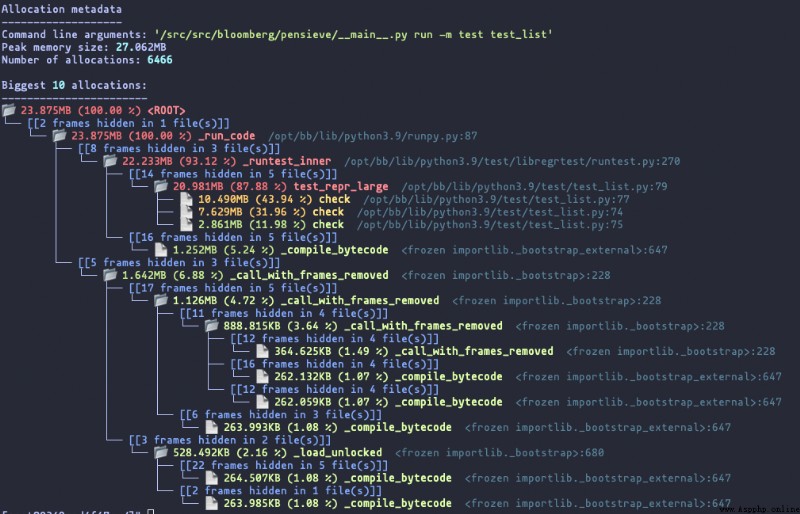
Tree Report
The report can clearly show the calling hierarchy of the program . The total amount and percentage of memory in the root node in the tree report Only for the data shown in the figure , Those that occupy less memory are not in the figure .
Statistical report
This report can display detailed information about the memory usage of the program , Including the total amount of memory allocated 、 Allocation type ( for example MALLOC, CALLOC) etc. .
https://github.com/bloomberg/memrayAt present, only in Linux On the platform Memray. because Memray Used C Language , Released version It's binary , So you have to install the binary compiler on the system first . Later on Python3.7+ Environment Lower installation Memray:
python3 -m pip install memray If you want to install the development version Memray, First, install binary tools on the system :libunwind and liblz4, Then clone the project and run the following command to install :
git clone [email protected]:bloomberg/memray.git memray
cd memray
python3 -m venv ../memray-env/  # just an example, put this wherever you want
source ../memray-env/bin/activate
python3 -m pip install --upgrade pip
python3 -m pip install -e . -r requirements-test.txt -r requirements-extra.txtBasic use
We can use the following command to track python Memory allocation of code ,my_script.py Is the file to be analyzed :
python3 -m memray run my_script.pyAlso can put the memray Use as a command line tool , for example :
memray run my_script.py
memray run -m my_module
The above command will output a binary file , Then we can generate statistical reports as needed . Suppose we want to generate a summary report , Then you can run the following command :
memray summary my_script.binA summary report of program memory allocation will be generated :
Different report forms are shown in the introduction section , Please check by yourself .
analysis C/C++ Memory allocation for code
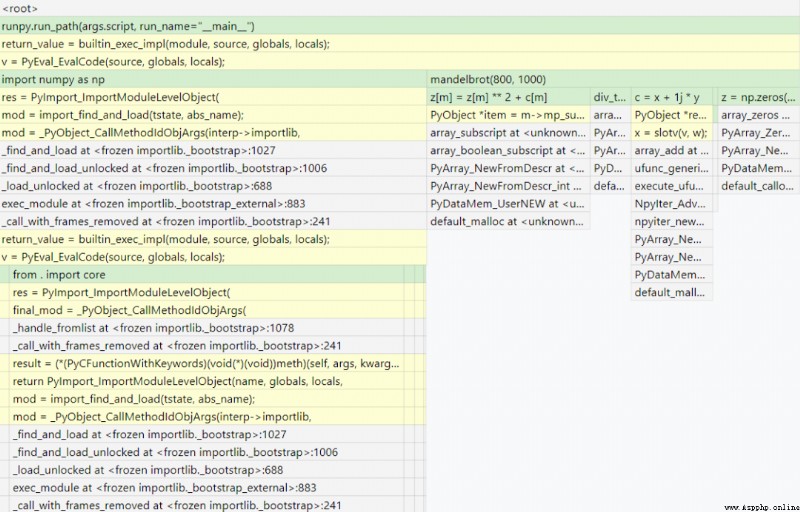
When you want to use Memray analysis numpy perhaps pandas This kind of inclusion C Code modules , We can run the following command :
memray run --native my_script.pySo as to visually see Python How much memory is allocated by the code , How much memory is allocated by the expansion module .
Suppose we use... In a file Numpy, When we don't use --native when , The generated statistical report is shown in the figure below :
It can be seen from the figure that Numpy Array allocated memory , But it is not clear that Numpy still Python The interpreter allocated memory . By using --native command , You can get one A more comprehensive report , As shown in the figure :
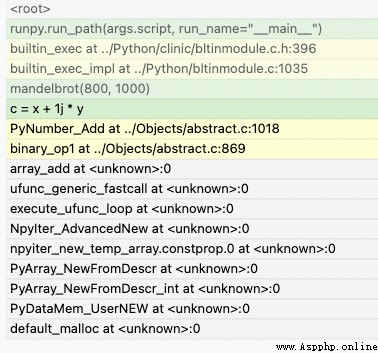
As you can see from the diagram Numpy in C Module invocation , When adding Numpy After array , Memory allocation is generated . We can distinguish by the suffix of the file Python Module and C modular .
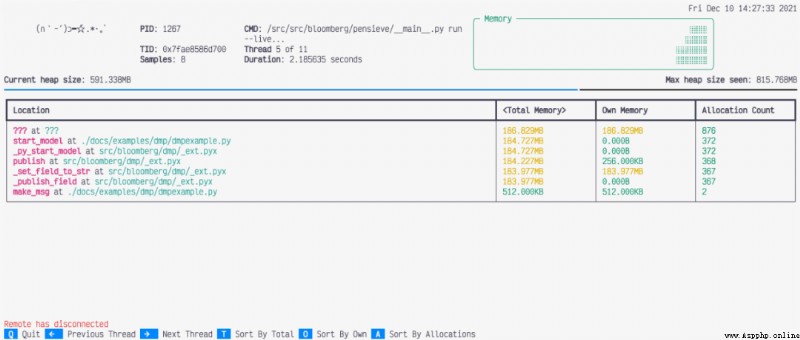
View memory allocation changes while the code is running
Memray It also supports dynamic viewing Python Memory allocation of code , We just need to use the following command :
memray run --live my_script.pyIn this mode , Developers can debug code that runs longer . The following figure shows the memory allocation of file runtime :
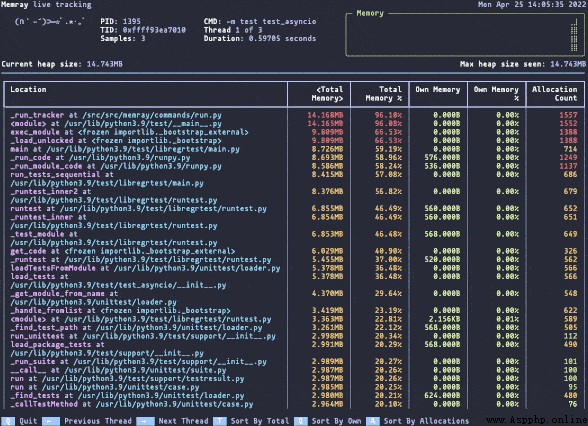
Sorting results
The results in the statistics report are usually based on the total memory allocated , From big to small . We can change the sorting conditions :
t ( Default ): Arrange according to total memory
o: Arrange according to the memory occupied by each function
a: Arrange according to the number of unreleased memory
View other threads
Use live By default, the command shows the memory allocation of the main thread , We can switch to other threads through the left and right arrows .
API
Besides using memray run see Python Memory allocation for code , You can also do it in Python Used in program memray.
import memray
with memray.Tracker("output_file.bin"):
    print("Allocations will be tracked until the with block ends")
More details can be found in the related API file [1].
We usually write Python In the process of code , Sometimes only the realization of business functions is considered , While ignoring the rationality and standardization of the code , For example, memory allocation is a very important point , Proper memory allocation helps Improve the running speed of the project .
Memray Is a support view Python Code memory allocation tools , Its convenience lies in : We can... As needed , Generate multiple analysis reports , So as to intuitively understand the memory allocation of your own code , Avoid memory leaks .
You write Python Do you pay attention to memory usage when you code ?
Reference material :
[1]
API file : https://bloomberg.github.io/memray/api.html

Python The cat technology exchange group is open ! In the group, there are in-service employees of the first and second tier large factories in China , There are also students at home and abroad , There are more than ten years old programming birds , There are also new people who have just entered primary and secondary schools , The learning atmosphere is good ! Students who want to join the group , Please reply in the public number 『 Communication group 』, Get brother cat's wechat ( No advertising party , If you are the one !)~
Not yet ? Try them
▲ How to use Docker Build enterprise class PyPi service ?
▲Python Why does the function return by default None?
▲ stay Google After working for ten years
▲Python Program debugging analysis big killer collection
▲Python craftsman : The principle of writing object-oriented code ( in )
▲Python What should be paid attention to when calculating memory ?
If you find this article helpful
Please share generously and give the thumbs-up , Thank you !
 Python writes a little game: guess idioms by looking at pictures (Part 2)
List of articles Preface Loo
 Python object oriented -- basic concepts of classes and objects, relationships between classes and objects, and class design
One 、 Concepts of classes and