1. Count the number of letters in the string : Four ways
string = "Hann Yang's id: boysoft2002"
print( sum(map(lambda x:x.isalpha(),string)) )
print( len([*filter(lambda x:x.isalpha(),string)]) )
print( sum(['a'<=s.lower()<='z' for s in string]) )
import re
print( len(re.findall(r'[a-z]', string, re.IGNORECASE)) )
2. A line of code to find the number of daffodils
[*filter(lambda x:x==sum(map(lambda n:int(n)**3,str(x))),range(100,1000))]Enhanced daffodil : The sum of the power of the integer bits of an integer is equal to the integer itself . Such as :
1634 == 1^4 + 6^4 + 3^4 + 4^4
92727 == 9^5 + 2^5 + 7^5 + 2^5+7^5
548834 == 5^6 + 4^6 + 8^6+ 8^6+ 3^6 + 4^6
seek 3~7 Number of daffodils , It was used 81 second :
[*filter(lambda x:x==sum(map(lambda n:int(n)**len(str(x)),str(x))),range(100,10_000_000))]
# [153, 370, 371, 407, 1634, 8208, 9474, 54748, 92727, 93084, 548834, 1741725, 4210818, 9800817, 9926315]
Don't try to calculate 7 More than , It's too time consuming . I spent nearly a year 15 Minutes to get 3 individual 8 Number of daffodils :
>>> t=time.time();[*filter(lambda x:x==sum(map(lambda n:int(n)**len(str(x)),str(x))),range(10_000_000,100_000_000))];print(time.time()-t)
[24678050, 24678051, 88593477]
858.7982144355774
3. Quick generation of dictionaries 、 Key exchange 、 Merge :
>>> dict.fromkeys('abcd',0) # Only one default value can be set
{'a': 0, 'b': 0, 'c': 0, 'd': 0}
>>> d = {}
>>> d.update(zip('abcd',range(4)))
>>> d
{'a': 0, 'b': 1, 'c': 2, 'd': 3}
>>> d = dict(enumerate('abcd'))
>>> d
{0: 'a', 1: 'b', 2: 'c', 3: 'd'}
>>> dict(zip(d.values(), d.keys()))
{'a': 0, 'b': 1, 'c': 2, 'd': 3}
>>> dict([v,k] for k,v in d.items())
{'a': 0, 'b': 1, 'c': 2, 'd': 3}
>>> d1 = dict(zip(d.values(), d.keys()))
>>>
>>> d = dict(enumerate('cdef'))
>>> d2 = dict(zip(d.values(), d.keys()))
>>> d2
{'c': 0, 'd': 1, 'e': 2, 'f': 3}
>>>
>>> {**d1, **d2}
{'a': 0, 'b': 1, 'c': 0, 'd': 1, 'e': 2, 'f': 3}
>>> {**d2, **d1}
{'c': 2, 'd': 3, 'e': 2, 'f': 3, 'a': 0, 'b': 1}
# When merging, the previous dictionary shall prevail , The latter also has keys that will be overwritten , What is not added
4. Non - overlapping merging of dictionaries : The values of key repetition are added or tuples 、 Collection storage
dicta = {"a":3,"b":20,"c":2,"e":"E","f":"hello"}
dictb = {"b":3,"c":4,"d":13,"f":"world","G":"gg"}
dct1 = dicta.copy()
for k,v in dictb.items():
dct1[k] = dct1.get(k,0 if isinstance(v,int) else '')+v
dct2 = dicta.copy()
for k,v in dictb.items():
dct2[k] = (dct2[k],v) if dct2.get(k) else v
dct3 = {k:{v} for k,v in dicta.items()}
for k,v in dictb.items():
dct3[k] = set(dct3.get(k))|{v} if dct3.get(k) else {v} # Union operation |
print(dicta, dictb, sep='\n')
print(dct1, dct2, dct3, sep='\n')
'''
{'a': 3, 'b': 20, 'c': 2, 'e': 'E', 'f': 'hello'}
{'b': 3, 'c': 4, 'd': 13, 'f': 'world', 'G': 'gg'}
{'a': 3, 'b': 23, 'c': 6, 'e': 'E', 'f': 'helloworld', 'd': 13, 'G': 'gg'}
{'a': 3, 'b': (20, 3), 'c': (2, 4), 'e': 'E', 'f': ('hello', 'world'), 'd': 13, 'G': 'gg'}
{'a': {3}, 'b': {3, 20}, 'c': {2, 4}, 'e': {'E'}, 'f': {'world', 'hello'}, 'd': {13}, 'G': {'gg'}}
'''
5. Whether three sides can form a triangle :
# Traditional judgment : if a+b>c and b+c>a and c+a>b:
a,b,c = map(eval,input().split())
p = (a+b+c)/2
if p > max([a,b,c]):
s = (p*(p-a)*(p-b)*(p-c))**0.5
print('{:.2f}'.format(s))
else:
print(' Can't make a triangle ')
# Or written :
p = a,b,c = [*map(eval,input().split())]
if sum(p) > 2*max(p):
p = sum(p)/2
s = (p*(p-a)*(p-b)*(p-c))**0.5
print('%.2f' % s)
else:
print(' Can't make a triangle ')
6. Zen of Python In the words of , Word frequency ranking top 6 Draw a statistical chart
import matplotlib.pyplot as plt
from this import s,d
import re
plt.rcParams['font.sans-serif'] = ['SimHei'] # Used to display Chinese labels normally
plt.rcParams['axes.unicode_minus'] = False # Used to display negative sign normally
dat = ''
for t in s: dat += d.get(t,t)
dat = re.sub(r'[,|.|!|*|\-|\n]',' ',dat) # Replace all punctuation , Abbreviations count as one word it's、aren't...
lst = [word.lower() for word in dat.split()]
dct = {word:lst.count(word) for word in lst}
dct = sorted(dct.items(), key=lambda x:-x[1])
X,Y = [k[0] for k in dct[:6]],[v[1] for v in dct[:6]]
plt.figure(' Word frequency statistics ',figsize=(12,5))
plt.subplot(1,3,1) # Row, column and sequence number of subgraph , Two rows and two columns (2,2,1)
plt.title(" Broken line diagram ")
plt.ylim(0,12)
plt.plot(X, Y, marker='o', color="red", label=" Legend 1 ")
plt.legend()
plt.subplot(1,3,2)
plt.title(" Histogram ")
plt.ylim(0,12)
plt.bar(X, Y, label=" Legend 2 ")
plt.legend()
plt.subplot(1,3,3)
plt.title(" The pie chart ")
exp = [0.3] + [0.2]*5 # From the center of the circle
plt.xlim(-4,4)
plt.ylim(-4,8)
plt.pie(Y, radius=3, labels=X, explode=exp,startangle=120, autopct="%3.1f%%", shadow=True, counterclock=True, frame=True)
plt.legend(loc="upper right") # Legend position upper right
plt.show()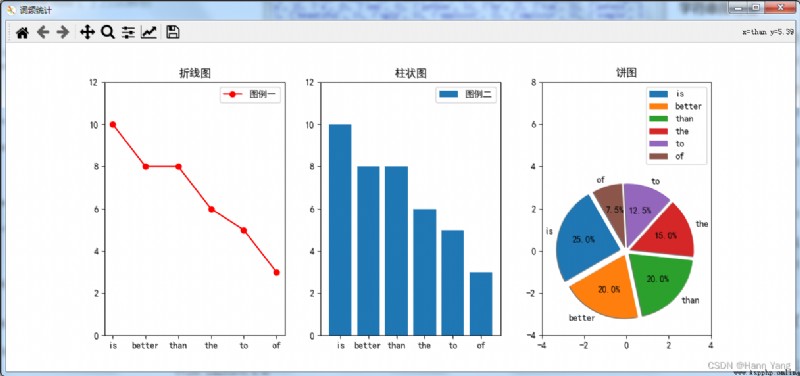
matplotlib.pyplot.pie Parameter table
Python Tips accumulated in question and answer channel ( One )
https://hannyang.blog.csdn.net/article/details/124935045
Python Tips accumulated in question and answer channel ( Two )
https://hannyang.blog.csdn.net/article/details/125026881
Python Tips accumulated in question and answer channel ( 3、 ... and )
https://hannyang.blog.csdn.net/article/details/125058178
Python Tips accumulated in question and answer channel ( Four )
https://hannyang.blog.csdn.net/article/details/125211774
Python Tips accumulated in question and answer channel ( 5、 ... and )
https://hannyang.blog.csdn.net/article/details/125270812