The code is created as follows :
''' Create test data sets '''
def createDataset():
dataSet = [['sunny', 'hot', 'high', 'weak', 'no'],
['sunny', 'hot', 'high', 'strong', 'no'],
['overcast', 'hot', 'high', 'weak', 'yes'],
['rain', 'mild', 'high', 'weak', 'yes'],
['rain', 'cool', 'normal', 'weak', 'yes'],
['rain', 'cool', 'normal', 'strong', 'no'],
['overcast', 'cool', 'normal', 'strong', 'yes'],
['sunny', 'mild', 'high', 'weak', 'no'],
['sunny', 'cool', 'normal', 'weak', 'yes'],
['rain', 'mild', 'normal', 'weak', 'yes'],
['sunny', 'mild', 'normal', 'strong', 'yes'],
['overcast', 'mild', 'high', 'strong', 'yes'],
['overcast', 'hot', 'normal', 'weak', 'yes'],
['rain', 'mild', 'high', 'strong', 'no']] # Data sets
labels = ['outlook', 'temperature', 'humidity', 'wind'] # Classification properties
return dataSet, labels
The table created by the code corresponds to the above table one by one !
Entropy usually indicates the degree of chaos of things , The greater the entropy, the greater the degree of chaos , Smaller means less confusion .
Suppose the current sample set 𝐷 contain ℓ Class sample , Among them the first 𝑘 The proportion of class samples is 𝑝𝑘 (𝑘 = 1, 2, · · · , ℓ), be 𝐷 The entropy of information is defined as :
Take whether the activity is going on , In the activity column attribute , There are two values for activities : Cancel (5 individual ) And carry on (9 individual ), You can calculate H( Activities ), The information entropy of the activity :
The code operation is as follows :
''' Calculate Shannon entropy '''
def shannonEnt(dataSet):
len_dataSet = len(dataSet) # Get the number of rows in the dataset
labelCounts = {
} # Create a dictionary , Used to calculate , The number of occurrences of each attribute value
shannonEnt = 0.0 # Let the initial value of Shannon entropy be 0
for element in dataSet: # Analyze each piece of data one by one
currentLabel = element[-1] # Extract attribute value information
if currentLabel not in labelCounts.keys(): # Take the attribute name as labelCounts Of this dictionary key
labelCounts[currentLabel] = 0 # Set the initial value of the dictionary value by 0
labelCounts[currentLabel] += 1 # value Gradually increase the value by one , To achieve the function of counting the number of tag occurrences
for key in labelCounts: # Traversing the dictionary key
proportion = float(labelCounts[key])/len_dataSet
shannonEnt -= proportion*log(proportion, 2) # According to the formula, the Shannon entropy
print(' The number of times the attribute value appears :{}'.format(labelCounts))
print(' The information entropy of the activity is :{}'.format(shannonEnt))
return shannonEnt

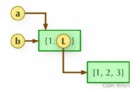
Suppose discrete properties 𝑎 Yes 𝑚 Possible values {𝑎1, 𝑎2, · · · , 𝑎𝑚}, If you use 𝑎 Come on Sample set 𝐷 division , Will produce 𝑚 Branch nodes , Among them the first 𝑖 Branch nodes contain 了 𝐷 All in attributes 𝑎 The upper value is 𝑎𝑖 The sample of , Write it down as 𝐷𝑖. It can be calculated according to the formula Out 𝐷𝑖 The entropy of information , Then consider that the number of samples contained in different branch nodes is different , To branch Nodes are weighted |𝐷𝑖|/|𝐷|, That is, the greater the number of samples, the greater the influence of branch nodes , Then we can calculate the attribute 𝑎 For the sample set 𝐷 The result of division “ Information gain .
In fact, it is information entropy minus conditional entropy .
Take the information gain of weather attributes as an example
There are three values for weather attributes : Fine (5 individual )、 Yin (4 individual )、 rain (5 individual )


From this, we can calculate the weighted average entropy when weather attributes are divided into different values :
So information gain Gain( Activities , The weather ) by :
Empathy , You can calculate that Gain( Activities , temperature )、Gain( Activities , humidity )、Gain( Activities , The wind speed ), By comparing the size , Get the maximum information gain , The attribute corresponding to the maximum information gain is selected as the root node of the decision tree .
The code is calculated as follows :
''' Divide the data set , So it is more convenient to calculate the conditional entropy dataSet: Data sets i: Attributes that divide the data set ( Such as : The weather ) The index of (0) value: The value of the attribute to be returned ( Such as : a sunny day ) '''
def splitDataSet(dataSet, i, value):
splitDataSet = [] # Create a list , To hold Divided data set
for example in dataSet: # Traverse a given data set
if example[i] == value:
splitExample = example[:i]
splitExample.extend(example[i+1:])
splitDataSet.append(splitExample) # Get rid of i Attribute column , Generate new datasets , That is, divided data sets
return splitDataSet # Get the partitioned data set
''' Calculated information gain , So as to select the optimal attribute ( label ) '''
def chooseBestFeature(dataSet):
numFeature = len(dataSet[0]) - 1 # Find the number of attributes
baseEntropy = shannonEnt(dataSet) # Shannon entropy of the test data set , Information entropy
bestInfoGain = 0.0 # Create initial maximum information gain , Used to get the final maximum information gain
bestFeature = -1 # Used to get the attribute corresponding to the maximum information gain An index in a dataset ; among -1, It could be any number ( The range of numbers : Less than 0 Or greater than or equal to numFeature)
for i in range(numFeature):
featList = [example[i] for example in dataSet] # Get the first i Attributes , All corresponding attribute values
featValue = set(featList) # Create a set aggregate ( The elements in the set are not repeatable ), It is easier to see all attribute values
newEntropy = 0.0 # Create initial conditional entropy , The initial value is 0
for value in featValue: # Traverse each attribute value
subDataSet = splitDataSet(dataSet, i, value) # Call function , Divide the data set
proportion = float(len(subDataSet)/len(dataSet))
newEntropy += proportion*shannonEnt(subDataSet) # Calculate the conditional entropy by formula
infoGain = baseEntropy - newEntropy # Calculate the information gain by formula
print(' attribute %s The information gain of is %.3f' % (labels[i], infoGain)) # Print the information gain corresponding to each attribute
if infoGain > bestInfoGain: # By comparison , Select the index of the maximum information gain and its corresponding attributes in the data set
bestInfoGain = infoGain
bestFeature = i
print(' The attribute corresponding to the maximum gain is :%s' % labels[bestFeature])
return bestFeature
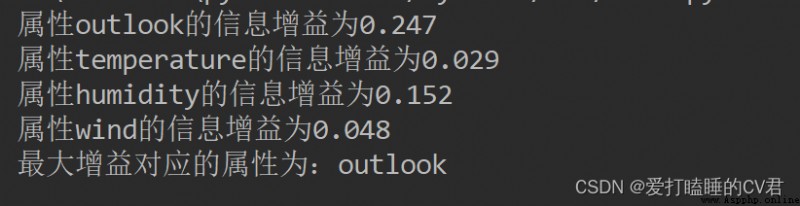
Diagram of function 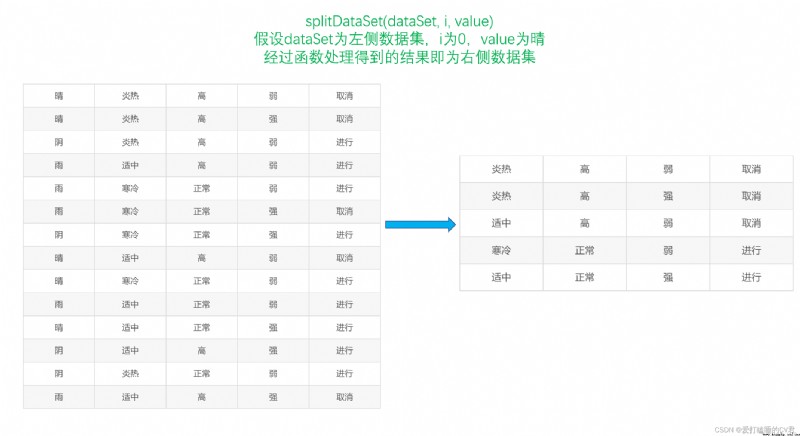
ID3 Decision tree algorithm :
''' Statistics classList The most common class tags in '''
def maxLabel(classList):
classCount = {
}
for vote in classList: # Statistics classCount The number of times an element appears in
if vote not in classCount.keys():
classCount[vote] = 0
classCount += 1
# Sort in descending order according to the dictionary values , The result is a list , The elements in the list are tuples
sortedClassCount = sorted(classCount.items(), key=operator.itemgetter(1), reverse=True)
return sortedClassCount[0][0] # return classCount The most frequently occurring element in
''' Build decision tree '''
def creatTree(dataSet, labels, featLabels):
classList = [example[-1] for example in dataSet] # Get category labels (yes or no)
if classList.count(classList[0]) == len(classList): # If the classification labels are the same , Then stop dividing
return classList[0]
if len(dataSet[0]) == 1: # If all the attributes are traversed , The category label that appears the most times in the result is returned
return maxLabel(classList)
bestFeature = chooseBestFeature(dataSet) # Get the index of the attribute corresponding to the maximum information gain in the data set
bestFeatureLabel = labels[bestFeature] # Get the attribute corresponding to the maximum information gain ( Such as : The weather )
featLabels.append(bestFeatureLabel)
myTree = {
bestFeatureLabel: {
}} # According to the maximum information gain of the label spanning tree
del(labels[bestFeature]) # Delete already used attributes
featureList = [example[bestFeature] for example in dataSet] # Get the attribute value of the optimal attribute in the data set ( Such as : a sunny day , It's raining )
featureValue = set(featureList) # Create set , Remove duplicate attribute values
for value in featureValue:
subLabels = labels[:] # New attribute tag set ( And labels comparison , Remove the attribute tags that have been used )
# Recursively call creatTree, To create a decision tree
myTree[bestFeatureLabel][value] = creatTree(splitDataSet(dataSet, bestFeature, value), subLabels, featLabels)
# print(featLabels)
return myTree
''' Use the decision tree for classification '''
def classify(myTree, featLabels, testData):
# global classLabel
firstStr = next(iter(myTree)) # Get the root node of the decision tree
# print(firstStr)
secondDict = myTree[firstStr] # Next Dictionary
# print(secondDict)
featIndex = featLabels.index(firstStr) # Get the index corresponding to the root node attribute in the test data set
# print(featIndex)
for key in secondDict.keys():
if testData[featIndex] == key:
if type(secondDict[key]).__name__ == 'dict': # type().__name__ The role of is , Judge data type
classLabel = classify(secondDict[key], featLabels, testData)
else:
classLabel = secondDict[key]
return classLabel

# -*- coding: UTF-8 -*-
""" # @Time: 2022/6/18 16:19 # @Author: Sleepy CV jun # @CSDN: https://blog.csdn.net/qq_44921056 """
from math import log
import operator
''' Create test data sets '''
def createDataset():
dataSet = [['sunny', 'hot', 'high', 'weak', 'no'],
['sunny', 'hot', 'high', 'strong', 'no'],
['overcast', 'hot', 'high', 'weak', 'yes'],
['rain', 'mild', 'high', 'weak', 'yes'],
['rain', 'cool', 'normal', 'weak', 'yes'],
['rain', 'cool', 'normal', 'strong', 'no'],
['overcast', 'cool', 'normal', 'strong', 'yes'],
['sunny', 'mild', 'high', 'weak', 'no'],
['sunny', 'cool', 'normal', 'weak', 'yes'],
['rain', 'mild', 'normal', 'weak', 'yes'],
['sunny', 'mild', 'normal', 'strong', 'yes'],
['overcast', 'mild', 'high', 'strong', 'yes'],
['overcast', 'hot', 'normal', 'weak', 'yes'],
['rain', 'mild', 'high', 'strong', 'no']] # Data sets
labels = ['outlook', 'temperature', 'humidity', 'wind'] # Classification properties
return dataSet, labels
''' Calculate Shannon entropy '''
def shannonEnt(dataSet):
len_dataSet = len(dataSet) # Get the number of rows in the dataset
labelCounts = {
} # Create a dictionary , Used to calculate , The number of occurrences of each attribute value
shannonEnt = 0.0 # Let the initial value of Shannon entropy be 0
for element in dataSet: # Analyze each piece of data one by one
currentLabel = element[-1] # Extract attribute value information
if currentLabel not in labelCounts.keys(): # Take the attribute name as labelCounts Of this dictionary key
labelCounts[currentLabel] = 0 # Set the initial value of the dictionary value by 0
labelCounts[currentLabel] += 1 # value Gradually increase the value by one , To achieve the function of counting the number of tag occurrences
for key in labelCounts: # Traversing the dictionary key
proportion = float(labelCounts[key])/len_dataSet
shannonEnt -= proportion*log(proportion, 2) # According to the formula, the Shannon entropy
# print(' The number of times the attribute value appears :{}'.format(labelCounts))
# print(' The information entropy of the activity is :{}'.format(shannonEnt))
return shannonEnt
''' Divide the data set , So it is more convenient to calculate the conditional entropy dataSet: Data sets i: Attributes that divide the data set ( Such as : The weather ) The index of (0) value: The value of the attribute to be returned ( Such as : a sunny day ) '''
def splitDataSet(dataSet, i, value):
splitDataSet = [] # Create a list , To hold Divided data set
for example in dataSet: # Traverse a given data set
if example[i] == value:
splitExample = example[:i]
splitExample.extend(example[i+1:])
splitDataSet.append(splitExample) # Get rid of i Attribute column , Generate new datasets , That is, divided data sets
return splitDataSet # Get the partitioned data set
''' Calculated information gain , So as to select the optimal attribute ( label ) '''
def chooseBestFeature(dataSet):
numFeature = len(dataSet[0]) - 1 # Find the number of attributes
baseEntropy = shannonEnt(dataSet) # Shannon entropy of the test data set , Information entropy
bestInfoGain = 0.0 # Create initial maximum information gain , Used to get the final maximum information gain
bestFeature = -1 # Used to get the attribute corresponding to the maximum information gain An index in a dataset ; among -1, It could be any number ( The range of numbers : Less than 0 Or greater than or equal to numFeature)
for i in range(numFeature):
featList = [example[i] for example in dataSet] # Get the first i Attributes , All corresponding attribute values
featValue = set(featList) # Create a set aggregate ( The elements in the set are not repeatable ), It is easier to see all attribute values
newEntropy = 0.0 # Create initial conditional entropy , The initial value is 0
for value in featValue: # Traverse each attribute value
subDataSet = splitDataSet(dataSet, i, value) # Call function , Divide the data set
proportion = float(len(subDataSet)/len(dataSet))
newEntropy += proportion*shannonEnt(subDataSet) # Calculate the conditional entropy by formula
infoGain = baseEntropy - newEntropy # Calculate the information gain by formula
# print(' attribute %s The information gain of is %.3f' % (labels[i], infoGain)) # Print the information gain corresponding to each attribute
if infoGain > bestInfoGain: # By comparison , Select the index of the maximum information gain and its corresponding attributes in the data set
bestInfoGain = infoGain
bestFeature = i
# print(' The attribute corresponding to the maximum gain is :%s' % labels[bestFeature])
return bestFeature
''' Statistics classList The most common class tags in '''
def maxLabel(classList):
classCount = {
}
for vote in classList: # Statistics classCount The number of times an element appears in
if vote not in classCount.keys():
classCount[vote] = 0
classCount += 1
# Sort in descending order according to the dictionary values , The result is a list , The elements in the list are tuples
sortedClassCount = sorted(classCount.items(), key=operator.itemgetter(1), reverse=True)
return sortedClassCount[0][0] # return classCount The most frequently occurring element in
''' Build decision tree '''
def creatTree(dataSet, labels, featLabels):
classList = [example[-1] for example in dataSet] # Get category labels (yes or no)
if classList.count(classList[0]) == len(classList): # If the classification labels are the same , Then stop dividing
return classList[0]
if len(dataSet[0]) == 1: # If all the attributes are traversed , The category label that appears the most times in the result is returned
return maxLabel(classList)
bestFeature = chooseBestFeature(dataSet) # Get the index of the attribute corresponding to the maximum information gain in the data set
bestFeatureLabel = labels[bestFeature] # Get the attribute corresponding to the maximum information gain ( Such as : The weather )
featLabels.append(bestFeatureLabel)
myTree = {
bestFeatureLabel: {
}} # According to the maximum information gain of the label spanning tree
del(labels[bestFeature]) # Delete already used attributes
featureList = [example[bestFeature] for example in dataSet] # Get the attribute value of the optimal attribute in the data set ( Such as : a sunny day , It's raining )
featureValue = set(featureList) # Create set , Remove duplicate attribute values
for value in featureValue:
subLabels = labels[:] # New attribute tag set ( And labels comparison , Remove the attribute tags that have been used )
# Recursively call creatTree, To create a decision tree
myTree[bestFeatureLabel][value] = creatTree(splitDataSet(dataSet, bestFeature, value), subLabels, featLabels)
# print(featLabels)
return myTree
''' Use the decision tree for classification '''
def classify(myTree, featLabels, testData):
firstStr = next(iter(myTree)) # Get the root node of the decision tree
# print(firstStr)
secondDict = myTree[firstStr] # Next Dictionary
# print(secondDict)
featIndex = featLabels.index(firstStr) # Get the index corresponding to the root node attribute in the test data set
# print(featIndex)
for key in secondDict.keys():
if testData[featIndex] == key:
if type(secondDict[key]).__name__ == 'dict': # type().__name__ The role of is , Judge data type
classLabel = classify(secondDict[key], featLabels, testData)
else:
classLabel = secondDict[key]
return classLabel
if __name__ == '__main__':
dataSet, labels = createDataset() # Create test data sets and their labels
featLabels = [] # Used to store the best attribute value
myTree = creatTree(dataSet, labels, featLabels) # Generate decision tree
# print(' The decision tree is :{}'.format(myTree))
testData = ['sunny', 'hot', 'high', 'weak'] # Test data
result = classify(myTree, featLabels, testData) # To test
print(' The result of the decision :{}'.format(result))
among demo Is the file name of the decision tree source code written in the previous part
The functions used in the drawing can be referred to :https://matplotlib.org/stable/tutorials/text/annotations.html#sphx-glr-tutorials-text-annotations-py
# -*- coding: UTF-8 -*-
""" # @Time: 2022/6/19 16:44 # @Author: Sleepy CV jun # @CSDN: https://blog.csdn.net/qq_44921056 """
from matplotlib.font_manager import FontProperties
import matplotlib.pyplot as plt
import demo
# Define the text box and arrow format
decisionNode = dict(boxstyle='round4', fc='0.8')
leafNode = dict(boxstyle='circle', fc='0.8')
arrow_args = dict(arrowstyle='<-')
# Set Chinese font
font = FontProperties(fname=r"C:\Windows\Fonts\simsun.ttc", size=14)
""" Function description : Get the number of leaf nodes of the decision tree Parameters: myTree - Decision tree Returns: numLeafs - The number of leaf nodes of the decision tree """
def getNumLeafs(myTree):
numLeafs = 0 # Initialize leaf
# python3 in myTree.keys() The return is dict_keys, No, it's not list, So it can't be used myTree.keys()[0] Method to obtain node properties ,
# have access to list(myTree.keys())[0]
firstStr = next(iter(myTree))
secondDict = myTree[firstStr] # Get the next set of dictionaries
for key in secondDict.keys():
if type(secondDict[key]).__name__ == 'dict': # Test whether the node is a dictionary , If it's not a dictionary , Represents that this node is a leaf node
numLeafs += getNumLeafs(secondDict[key])
else:
numLeafs += 1
return numLeafs
""" Function description : Gets the number of layers of the decision tree Parameters: myTree - Decision tree Returns: maxDepth - The number of layers of the decision tree """
def getTreeDepth(myTree):
maxDepth = 0 # Initialize decision tree depth
# python3 in myTree.keys() The return is dict_keys, No, it's not list, So it can't be used myTree.keys()[0] Method to obtain node properties ,
# have access to list(myTree.keys())[0]
firstStr = next(iter(myTree))
secondDict = myTree[firstStr] # Get the next Dictionary
for key in secondDict.keys():
if type(secondDict[key]).__name__ == 'dict': # Test whether the node is a dictionary , If it's not a dictionary , Represents that this node is a leaf node
thisDepth = 1 + getTreeDepth(secondDict[key])
else:
thisDepth = 1
if thisDepth > maxDepth:
maxDepth = thisDepth # Update the number of layers
# print(maxDepth)
return maxDepth
""" Function description : Draw nodes Parameters: nodeTxt - Node name centerPt - Text location parentPt - The arrow position of the dimension nodeType - Node format """
def plotNode(nodeTxt, centerPt, parentPt, nodeType):
arrow_args = dict(arrow) # Define the arrow format
font = FontProperties(fname=r"C:\Windows\Fonts\simsun.ttc", size=14) # Set Chinese font
createPlot.ax1.annotate(nodeTxt, xy=parentPt, xycoords='axes fraction', # Draw nodes
xytext=centerPt, textcoords='axes fraction',
va="center", ha="center", bbox=nodeType, arrowprops=arrow_args, fontproperties=font)
""" Function description : Label the directed edge attribute value Parameters: cntrPt、parentPt - Used to calculate dimension position txtString - What is marked """
def plotMidText(cntrPt, parentPt, txtString):
xMid = (parentPt[0] - cntrPt[0]) / 2.0 + cntrPt[0] # Calculate dimension position
yMid = (parentPt[1] - cntrPt[1]) / 2.0 + cntrPt[1]
createPlot.ax1.text(xMid, yMid, txtString, va="center", ha="center", rotation=30)
""" Function description : Draw decision tree Parameters: myTree - Decision tree ( Dictionaries ) parentPt - What is marked nodeTxt - Node name """
def plotTree(myTree, parentPt, nodeTxt):
decisionNode = dict(box, fc="0.8") # Set node format
leafNode = dict(box, fc="0.8") # Format leaf nodes
numLeafs = getNumLeafs(myTree) # Get the number of decision leaf nodes , Determines the width of the tree
depth = getTreeDepth(myTree) # Get the number of decision tree layers
firstStr = next(iter(myTree)) # Next dictionary
cntrPt = (plotTree.xOff + (1.0 + float(numLeafs)) / 2.0 / plotTree.totalW, plotTree.yOff) # Center position
plotMidText(cntrPt, parentPt, nodeTxt) # Label the directed edge attribute value
plotNode(firstStr, cntrPt, parentPt, decisionNode) # Draw nodes
secondDict = myTree[firstStr] # Next Dictionary , That is, continue drawing child nodes
plotTree.yOff = plotTree.yOff - 1.0 / plotTree.totalD # y The offset
for key in secondDict.keys():
if type(secondDict[key]).__name__ == 'dict': # Test whether the node is a dictionary , If it's not a dictionary , Represents that this node is a leaf node
plotTree(secondDict[key], cntrPt, str(key)) # Not leaf nodes , The recursive call continues to draw
else: # If it's a leaf node , Draw leaf nodes , And marked with directed edge attribute value
plotTree.xOff = plotTree.xOff + 1.0 / plotTree.totalW
plotNode(secondDict[key], (plotTree.xOff, plotTree.yOff), cntrPt, leafNode)
plotMidText((plotTree.xOff, plotTree.yOff), cntrPt, str(key))
plotTree.yOff = plotTree.yOff + 1.0 / plotTree.totalD
""" Function description : Create a paint panel Parameters: inTree - Decision tree ( Dictionaries ) """
def createPlot(inTree):
fig = plt.figure(1, facecolor='white') # establish fig
fig.clf() # Empty fig
axprops = dict(xticks=[], yticks=[])
createPlot.ax1 = plt.subplot(111, frameon=False, **axprops) # Get rid of x、y Axis
plotTree.totalW = float(getNumLeafs(inTree)) # Get the number of decision leaf nodes
plotTree.totalD = float(getTreeDepth(inTree)) # Get the number of decision tree layers
plotTree.xOff = -0.5 / plotTree.totalW
plotTree.yOff = 1.0 # x The offset
plotTree(inTree, (0.5, 1.0), '') # Draw decision tree
plt.show()
if __name__ == '__main__':
dataSet, labels = demo.createDataset()
featLabels = []
myTree = demo.creatTree(dataSet, labels, featLabels)
createPlot(myTree)

This is the end of the article , But the story has no ending
If this article helps you , Remember to like it , It's also the greatest encouragement to the author .
If there are deficiencies, you can make more corrections in the comment area , I'll fix it as soon as I see it
author : Sleepy CV jun
CSDN:https://blog.csdn.net/qq_44921056
This article is only for communication learning , Without the permission of the author , Prohibited reproduced , Let alone for other purposes , Offenders will investigate .