Recently learning 《 utilize pandas Data analysis 》, Think of computer level II office There are ready-made examples , Although the basis of comparison , But it's still suitable for practicing .
This is level two office One of the test questions , It is not necessary to set the cell column width and the method for it in the title pandas Show in , Let's start directly from the 5 The beginning of the question .
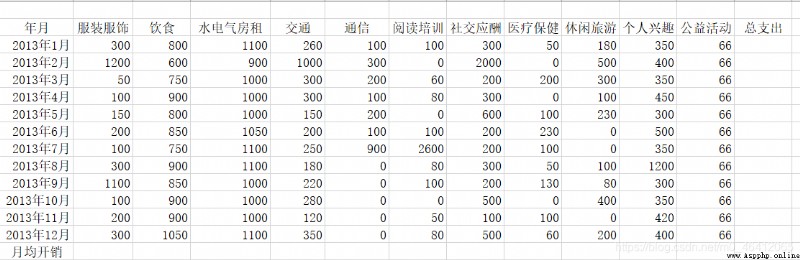
This is the initial table of the material file .
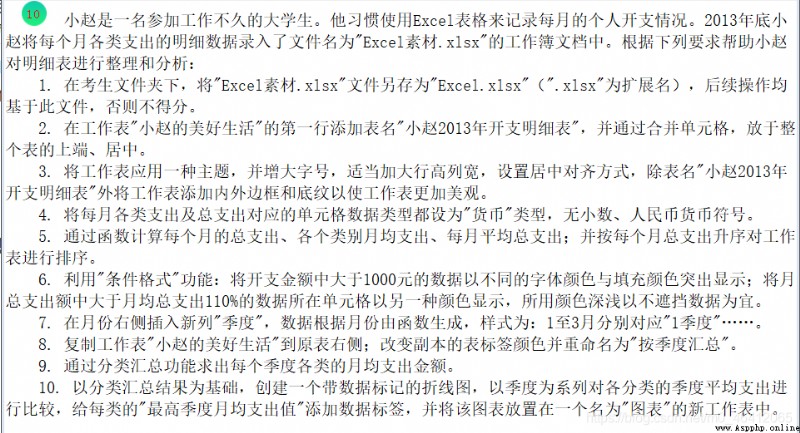
The fifth question asks to find out the total expenditure of each month 、 Monthly average expenditure for each category 、 Average total monthly expenditure 、 Finally, sort in ascending order according to the total expenditure .
table=pd.read_excel("Excel material .xlsx",header=1)
# Read the file
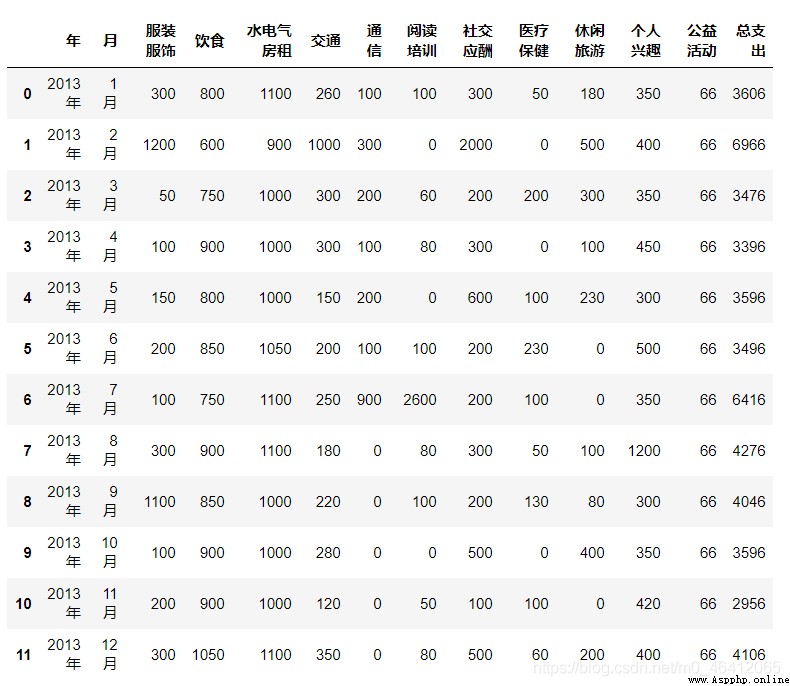
table[" Total expenditure "]=table.iloc[:,2:-1].sum(axis=1)
# The total expenditure first takes out the column of the requested sum , recycling sum function
table
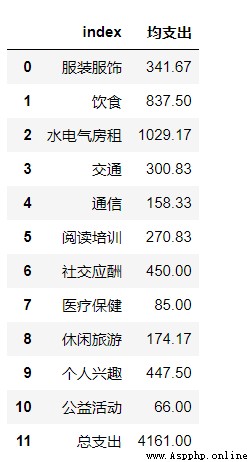
Then there is the monthly average expenditure of each category
classify_cost=table.iloc[:,2:-1].mean(axis=0)
# Also select the corresponding data , utilize mean function
classify_cost=classify_cost.round(2)
# Here use round() Method to keep the data to two decimal places
classify_cost
Finally, ascending sort
table.sort_values(by=" Total expenditure ",ascending=True)
#ascending=False Is sorted in descending order
To format a condition, use pandas Of style attribute , For detailed documents, please refer to the official documents :https://pandas.pydata.org/pandas-docs/stable/user_guide/style.html
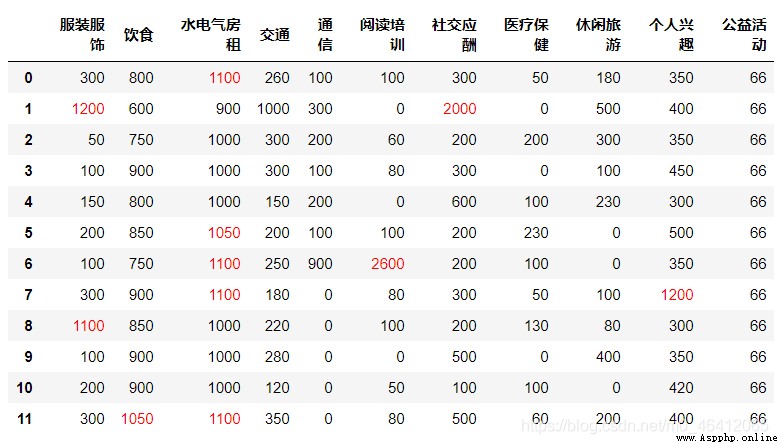
The first is to spend more than 1000 Fill with red .
def color_negative(val):
color="red" if val>1000 else "black"
return "color:%s"%color
table.iloc[:,2:-1].style.applymap(color_negative)
Insert quarter by month , We first extract the value of the month, i.e. remove “ month ” This word , Keep only specific values
month_num=table[" month "].str[:-1].astype("int")
# Note here that the type is converted to int type

And then use pandas Of cut Methods to classify
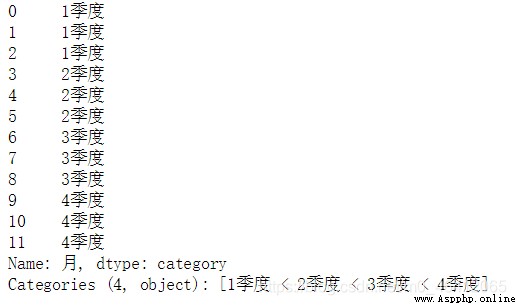
season=pd.cut(month_num,4,labels=["1 quarter ","2 quarter ","3 quarter ","4 quarter "])
season
Of course, you can also write a dictionary , And then use map Method
dic={
"1 month ":"1 quarter ","2 month ":"1 quarter ","3 month ":"1 quarter ","4 month ":"2 quarter ","5 month ":"2 quarter ",
"6 month ":"2 quarter ","7 month ":"3 quarter ","8 month ":"3 quarter ","9 month ":"3 quarter ","10 month ":"4 quarter ",
"11 month ":"4 quarter ","12 month ":"4 quarter "}
table[" quarter "]=table[" month "].map(dic)
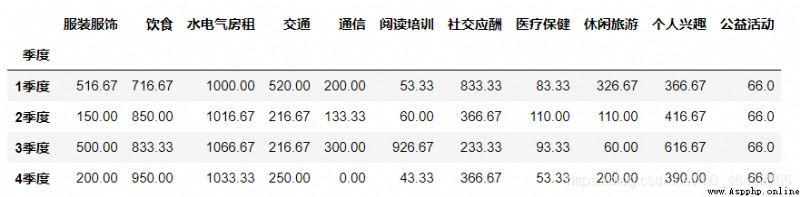
Calculate the monthly average expenditure amount of each quarter by classification summary , You can use it directly here pivot_table Method can also be used groupby
new_table=table.pivot_table([" Clothing and accessories "," diet "," Water, electricity and rent "," traffic "," signal communication "," Reading training "," Social intercourse "," Health care "," Leisure travel "," Personal interests "," public benefit activities "],
index=" quarter ",aggfunc="mean").round(2)
new_table
new_table=table.groupby([" quarter "])[" Clothing and accessories "," diet "," Water, electricity and rent "," traffic "," signal communication "," Reading training ",
" Social intercourse "," Health care "," Leisure travel "," Personal interests "," public benefit activities "].mean().round(2)
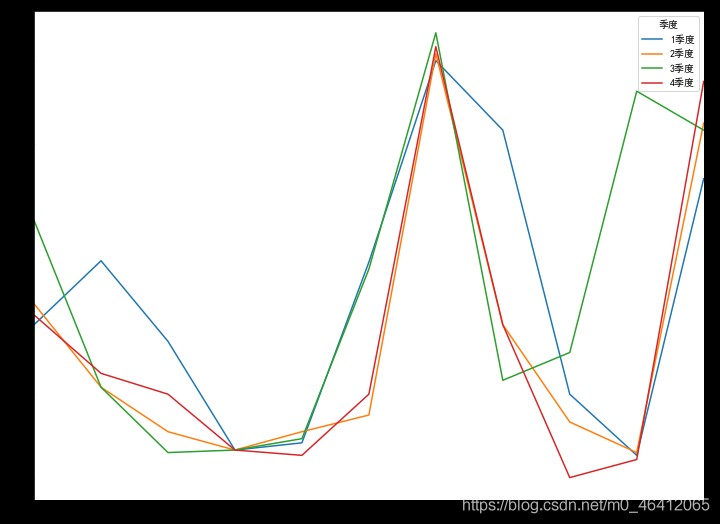
new_table.T.plot(figsize=(12,9))
# It's used here numpy Transpose method of , Swap the rows and columns of the table , Better mapping