I don't know how many little friends will stay in place for the new year this year , Although I can't go back to my hometown this Spring Festival , But this year has to pass , I have to buy new year's products , Give gifts to family elders . So out of curiosity, I used the crawler to get some valuable data , And combine Python Data analysis and third-party visualization platform to analyze what you have bought for the new year , The analysis results are as follows :
After using the cleaned data above finebi It's done by a third party visualization tool . The next step is to use Python Implementation process , For the narration of this article , It is mainly divided into the following five steps :
In fact, in terms of today's data , We mainly do exploratory analysis ; First, sort out the existing fields , There's a title ( Extract products )、 Price 、 sales 、 Shop name 、 Place of shipment . Let's do a detailed dimension splitting and visual graph selection :
category :
Price : The price range distribution of new year's goods ;( Doughnut , Proportion of observation )
sales 、 Shop name :
Place of shipment : Which cities have the highest sales volume ?( Map )
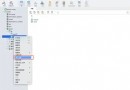
Crawling mainly uses selenium Simulated click browser , If it's installed selenium And browser driven , I use it here Google browser , Find the corresponding version number and download the corresponding version driver , Be sure to correspond to the version number of the browser .
pip install selenium
After successful installation , Run the following code , Enter key " necessities ", Just scan the code , Waiting for the program to collect .
# coding=utf8
import re
from selenium.webdriver.chrome.options import Options
from selenium import webdriver
import time
import csv
# Search for products , Get the product page number
def search_product(key_word):
# Locate the input box
browser.find_element_by_id("q").send_keys(key_word)
# Define the click button , And click the
browser.find_element_by_class_name('btn-search').click()
# Maximization window : To make it easier for us to scan the code
browser.maximize_window()
# wait for 15 second , Give us enough time to scan the code
time.sleep(15)
# Position this “ Page number ”, obtain “ common 100 Page text ”
page_info = browser.find_element_by_xpath('//div[@class="total"]').text
# It should be noted that :findall() It returns a list , Although there is only one element at this time, it is also a list .
page = re.findall("(\d+)", page_info)[0]
return page
# get data
def get_data():
# Through page analysis, we found that : All the information is in items Under the node
items = browser.find_elements_by_xpath('//div[@class="items"]/div[@class="item J_MouserOnverReq "]')
for item in items:
# parameter information
pro_desc = item.find_element_by_xpath('.//div[@class="row row-2 title"]/a').text
# Price
pro_price = item.find_element_by_xpath('.//strong').text
# Number of payers
buy_num = item.find_element_by_xpath('.//div[@class="deal-cnt"]').text
# Flagship store
shop = item.find_element_by_xpath('.//div[@class="shop"]/a').text
# Place of shipment
address = item.find_element_by_xpath('.//div[@class="location"]').text
# print(pro_desc, pro_price, buy_num, shop, address)
with open('{}.csv'.format(key_word), mode='a', newline='', encoding='utf-8-sig') as f:
csv_writer = csv.writer(f, delimiter=',')
csv_writer.writerow([pro_desc, pro_price, buy_num, shop, address])
def main():
browser.get('https://www.taobao.com/')
page = search_product(key_word)
print(page)
get_data()
page_num = 1
while int(page) != page_num:
print("*" * 100)
print(" Climbing to the top {} page ".format(page_num + 1))
browser.get('https://s.taobao.com/search?q={}&s={}'.format(key_word, page_num * 44))
browser.implicitly_wait(25)
get_data()
page_num += 1
print(" Data crawling completed !")
if __name__ == '__main__':
key_word = input(" Please enter the product you want to search :")
option = Options()
browser = webdriver.Chrome(chrome_options=option,
executable_path=r"C:\Users\cherich\AppData\Local\Google\Chrome\Application\chromedriver.exe")
main()
The results are as follows :
Data preparation complete , It's time-consuming to extract categories from the title in the middle , I suggest you use the data directly .
The idea is to segment the title , Named entity recognition , Mark the noun , Find the category name , Like nuts 、 Tea, etc .
The file cleaning here is almost Excel Get it done , The data set is small , use Excel It's very efficient , For example, a price range is made here . So far, data cleaning has been completed ( We can do visualization with three tools ), If everyone loves to toss , You can look down and use Python How to analyze .
1、 Read the file
import pandas as pd
import matplotlib as mpl
mpl.rcParams['font.family'] = 'SimHei'
from wordcloud import WordCloud
from ast import literal_eval
import matplotlib.pyplot as plt
datas = pd.read_csv('./ necessities .csv',encoding='gbk')
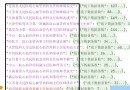
datas 2、 visualization : Clouds of words
li = []
for each in datas[' key word '].values:
new_list = str(each).split(',')
li.extend(new_list)
def func_pd(words):
count_result = pd.Series(words).value_counts()
return count_result.to_dict()
frequencies = func_pd(li)
frequencies.pop(' other ')
plt.figure(figsize = (10,4),dpi=80)
wordcloud = WordCloud(font_path="STSONG.TTF",background_color='white', width=700,height=350).fit_words(frequencies)
plt.imshow(wordcloud)
plt.axis("off")
plt.show()
Chart description : We can see the cloud picture of words , hot ( The most frequent occurrence ) Category font is the largest , In turn, is : nuts 、 The tea 、 Cakes, etc .
3、 visualization : Draw a circle
# plt.pie(x,lables,autopct,shadow,startangle,colors,explode)
food_type = datas.groupby(' Price range ').size()
plt.figure(figsize=(8,4),dpi=80)
explodes= [0,0,0,0,0.2,0.1]
size = 0.3
plt.pie(food_type, radius=1,labels=food_type.index, autopct='%.2f%%', colors=['#F4A460','#D2691E','#CDCD00','#FFD700','#EEE5DE'],
wedgeprops=dict(width=size, edgecolor='w'))
plt.title(' The proportion of annual price range ',fontsize=18)
plt.legend(food_type.index,bbox_to_anchor=(1.5, 1.0))
plt.show()
Chart description : A doughnut is similar to a pie chart , The proportion of representative parts relative to the whole , You can see 0 ~ 200 Yuan of new year's goods is about 33% about ,100 ~ 200 Yuan is also 33%. It shows that the price of most new year goods tends to 200 within .
4、 visualization : Draw a bar graph
data = datas.groupby(by=' Shop name ')[' sales '].sum().sort_values(ascending=False).head(10)
plt.figure(figsize = (10,4),dpi=80)
plt.ylabel(' sales ')
plt.title(' Top ten stores in annual sales ',fontsize=18)
colors = ['#F4A460','#D2691E','#CDCD00','#EEE5DE', '#EEB4B4', '#FFA07A', '#FFD700']
plt.bar(data.index,data.values, color=colors)
plt.xticks(rotation=45)
plt.show()
Chart description : The above is the ranking of stores by sales volume , You can see that the first place is the flagship store of three squirrels , It seems that everyone likes to eat dry goods during the Spring Festival .
5、 visualization : Draw a horizontal bar chart
foods = datas.groupby(by=' Category ')[' sales '].sum().sort_values(ascending=False).head(10)
foods.sort_values(ascending=True,inplace=True)
plt.figure(figsize = (10,4),dpi=80)
plt.xlabel(' sales ')
plt.title(' New year's products recommendation list ',fontsize=18)
colors = ['#F4A460','#D2691E','#CDCD00','#CD96CD','#EEE5DE', '#EEB4B4', '#FFA07A', '#FFD700']
plt.barh(foods.index,foods.values, color=colors,height=1)
plt.show()
Chart description : Ranking by category sales , Number one is nuts , The above hypothesis is verified , People like to eat nuts .
Taobao is selling new year's products : nuts , The tea , Cakes and Pastries , cookies , candy , Liquor and Spirits , walnut , mutton , Sea cucumber , Chinese wolfberry ;
Recommended list of new year's products ( By sales ): nuts 、 snacks 、 Cakes and Pastries 、 cookies 、 The tea 、 candy 、 Pine nuts 、 Red jujube 、 The cake 、 Bitterness 、 Melon seeds 、 milk 、 walnut ;
Price reference of new year goods :66% The price of the above new year's goods is 0~200 Yuan between ;
Hot stores : Three mice 、 Tmall supermarket 、 Grass bouquet smell 、 Ryohin keikaku shop ;