The company purchased a set of call center system provided by external suppliers , In the process of using, it is found that LOAD and CPU High occupancy , Because there is no source code and the internal implementation logic is not clear , The problem can only be eliminated by observing the consumption of system resources , The following records the troubleshooting process .
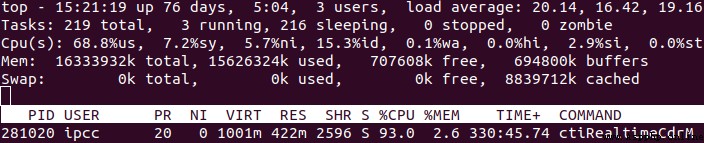
You can see it load Occupied as “20.14, 16.42, 19.16”, The three numbers represent cpu stay 1 minute 、5 Minutes and 15 Minutes of load,cpu The utilization rate of is also on the high side , Reached 68.8%, Occupy cpu Higher processes ID by 281020.
$ ps aux|grep 281020
root 212891 0.0 0.0 103328 848 pts/3 S+ 15:41 0:00 grep 281020
ipcc 281020 39.5 2.6 1025560 425540 ? Sl 01:18 341:29 /usr/bin/python ./ctiRealtimeCdrMain.py default.xml
The result shows that the application is python application .
stay top Add -H Parameters , View the threads in the process cpu Victory situation :
$ top -H -p 281020give the result as follows :
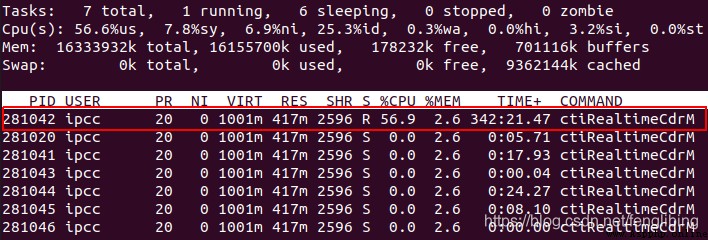
You can see the process 281020 The thread number in is 281042 The thread of wins CPU most .
adopt watch and pstack Command to view the execution of commands in the thread :
watch pstack 281042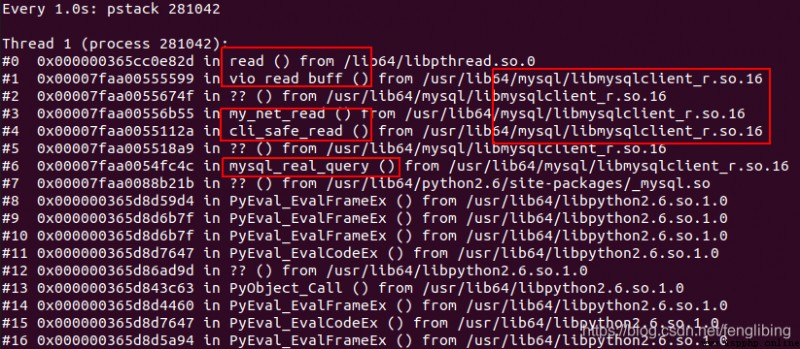
You can see from mysql It takes more resources to read data in .
Further adoption strace Command to verify :
$ strace -f -p 281042give the result as follows :
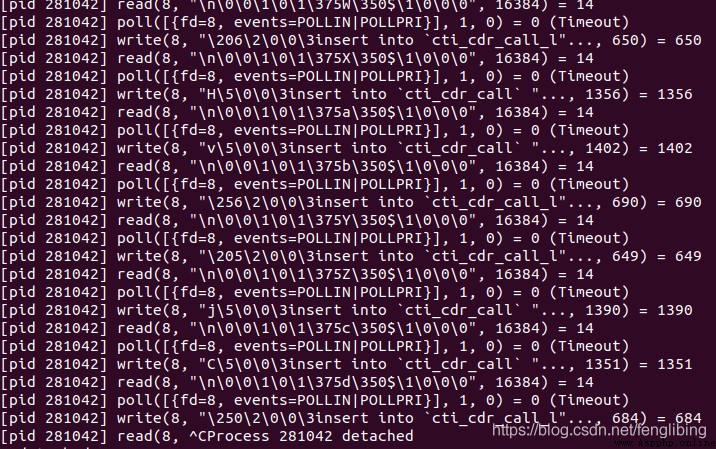
A large amount of data is being written to the database (write) And read (read) operation , above pstack The command does not reflect write The problem of , The problem should be in the database read Operationally , The preliminary guess is that the database select There is a problem with the statement , Or there is no index .
Further inspection MySql Slow log discovery of :
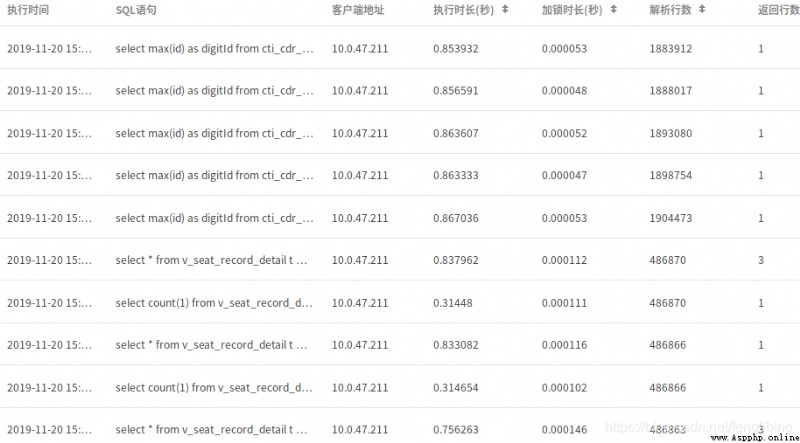
There are a large number of slow query logs ,SQL Full table scanning is used in count、max、min A function like this , Finally, the cause of the problem is confirmed , The rest is to let the other party optimize .