Pygal Is another easy-to-use data library , It creates various data graphs in an object-oriented way , And use Pygal It is very convenient to generate data graphs in various formats , Include PNG、SVG etc. . Use Pygal It can also generate XML etree、HTML form ( These all require the installation of other packages ).
install Pygal Package and install others Python The packages are basically the same , It can also be used pip To install .
Start command line window , Enter the following command in the command line window :
The above command will automatically install Pygal The latest version of the package . Run the above command , You can see that the program is downloaded first Pygal package , Then prompt Pygal Package installed successfully :
Installing collected packages:pygal
Successfully installed pygal-2.4.0
If you are prompted in the command line window that pip command , It can also be done by python The command runs pip Module to install Pygal. for example , Use the following command to install Pygal package :
python -m pip install pygal
After successful installation Pygal After the package , Can pass pydoc Check it out. Pygal Package documentation . Enter the following command in the command line window :
python -m pydoc -p 8899
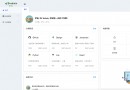
After running the above command , Open the browser to view http://localhost:8899/ page , Can be in Python Installation directory lib\site-packages I can see Pygal Package documentation , Pictured 1 Shown .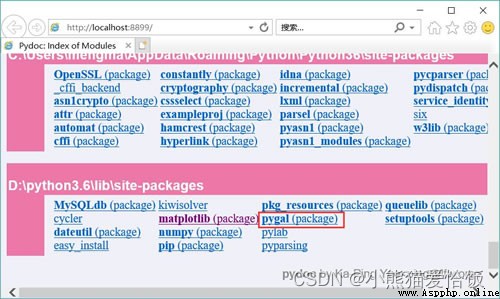
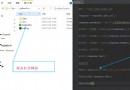
Click on the graph 1 On the page shown “pygal(package)” link , You will see the following figure 2 Shown API page .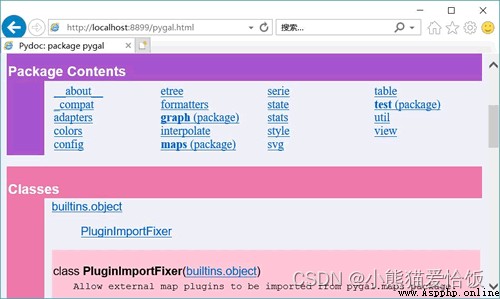
Pass diagram 2 The page shown , You can view it Pygal Sub modules and classes under the package .
Pygal Use object-oriented method to generate data graph . Use Pygal The steps to generate the data graph are as follows :
establish Pygal Data graph object .Pygal Different classes are provided for different data graphs , For example, the histogram uses pygal.Bar class , The pie chart using pygal.Pie class , Line chart uses pygal.Line class , wait .
Call the... Of the data graph object add() Method to add data .
call Config Object attribute configuration data graph .
Call the... Of the data graph object render_to_xxx() Method to render the data graph to the specified output node ( The output node here can be PNG picture 、SVG file , It can also be other nodes ).
The following shows how to use... By generating a simple histogram Pygal Generate data graph , This histogram shows two tutorials from 2011 Year to 2017 Annual sales statistics :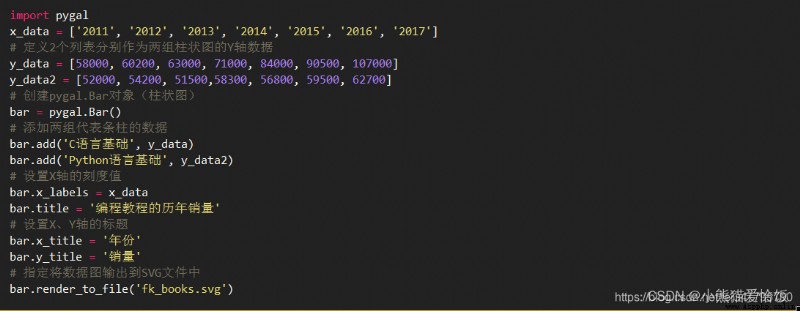
In the above procedure, No 8 Line of code creates pygal.Bar object , This object represents a histogram . The next two lines of code are pygal.Bar Object adds two sets of histogram data .
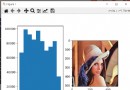
Through the above procedure , In fact, it is possible to generate simple histogram . If the face pygal.Bar Object's attribute assignment code , Run the program , You will see that a... Is generated in the current directory of the program fk_books.svg file , Use the browser to view the file , You can see the figure below 3 The histogram shown .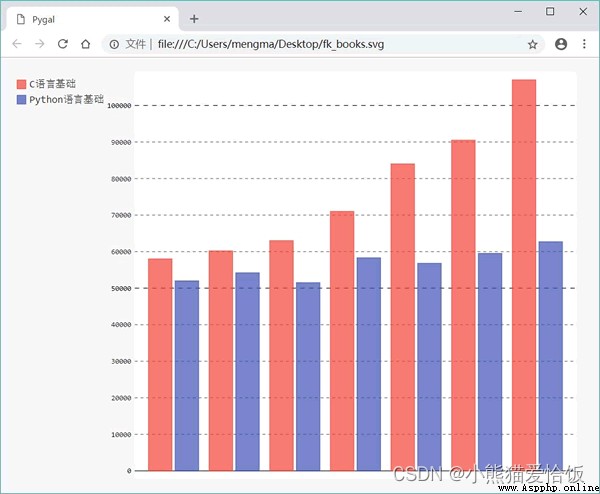
chart 4 Interactive SVG Data graph
As you can see from the previous program , Use pygal.Bar After generating the data graph , The program can configure the data graph by assigning values to the attributes of the object . that , In addition to setting these simple properties , Can I set other properties ?
The answer is yes , Look up http://localhost:8899/pygal.config.html page ( among 8899 Is to run pydoc The port of ), You can see config Description of relevant modules , This module contains BaseConfig、CommonConfig、Config、SerieConfig Equal configuration class , These classes contain properties that are used to configure Pygal Data graph .
The following program demonstrates the function of some configuration attributes in this page :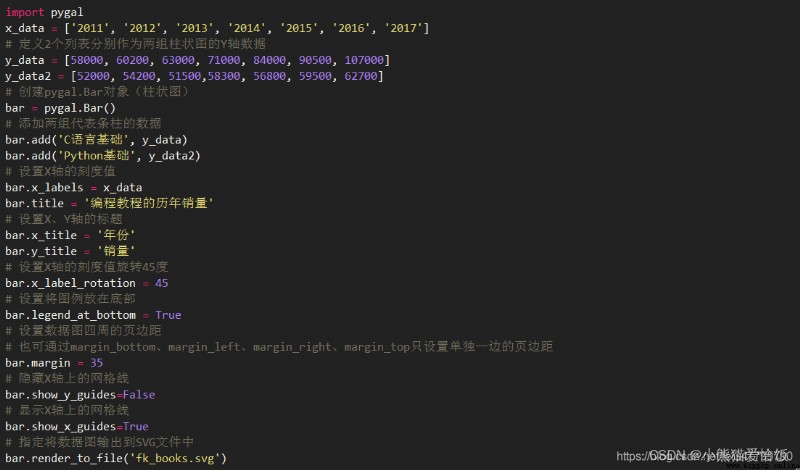
Run the above program , The following figure will be generated 5 Data diagram shown in .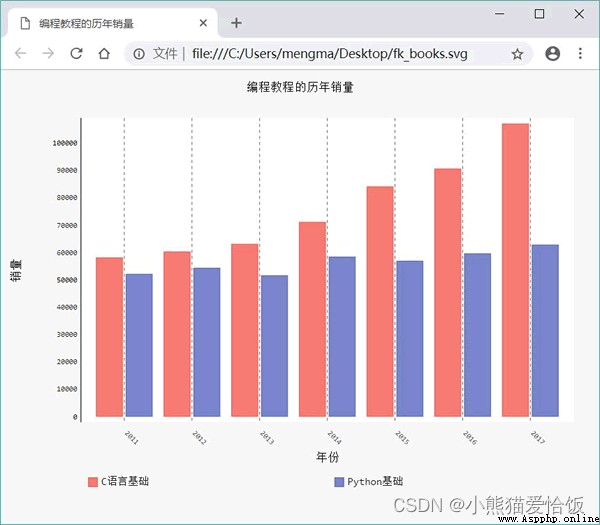
chart 5 Configure the data graph
Contrast figure 4 Sum graph 5 Data diagram shown in , You can find the figure 5 Of the data graph shown in X The axis scale value is rotated 45°, This is a x_label_rotation The function of attributes ; The legend of the data graph is displayed at the bottom , This is a legend_at_bottom The function of attributes ; The data graph no longer shows the horizontal grid money , This is a show_y_guides The function of attributes ; The data graph shows the grid lines in the vertical direction , This is a show_x_guides The function of attributes .
For different data graphs ,Pygal Support a large number of corresponding configurations , Specific can be combined with http://localhost:8899/pygal.config.html Set the properties given on the page 、 test , There will be no more explanation here .