I don't know if you have encountered such a situation , In the production environment Python The process suddenly got stuck , All other threads cannot be scheduled , If we kill Drop and restart , Usually, the context information of the current error will be lost , Lose this information , Not very friendly to subsequent error reports , Can you keep it open Python In the case of the program , See what's wrong with the program ?
First , You can try , I mentioned earlier py-spy( comic : How to analyze the running Python Program ?),py-spy You can print out simple call information , But many times it is not enough , Here we go through gdb To debug Python Program , Print at the same time c Stack and py Stack information , Debug , Be clear at a glance .
gdb Mainly used for debugging c/c++ programmatic , because Python It's using c Written (cpython, Of course, there are other languages that implement ), Yes gdb for , take python As ordinary c Program debugging can .
When we use gdb debugging python Process time , We will get debugging information and memory status at the interpreter level , Not at the application level ( We use pdb Is the basic of the application ), So we can see Python Complete execution process , Including information about functions and variables on the interpreter .
My server is Ubuntu 20.04, So the operation of this article is Ubuntu 20.04 on .
First , It needs to be installed gdb.
sudo apt-get install gdbLight installation gdb, In the debug python when , Although it can be used , But not very friendly , In order to better browse debugging information , We are cpython install gdb debugging Symbols.
gdb Medium debugging Symbols Its main function is to map the compiled binary instructions of the program to the corresponding variables of the source code 、 Functions and lines , In this way, you can browse the debugging information during debugging .
stay Ubuntu in , install python-dbg Can be .
sudo apt-get install python-dbgpython-dbg Provides gdb Debugging Symbols And some debugging python The order of , Such as py-bt、py-list, Later in this article, we will use .
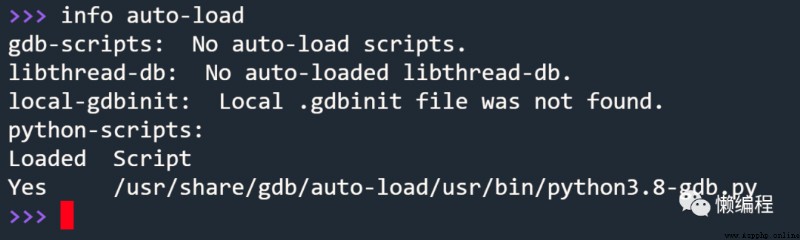
python-dbg The reason why it works , Because it will python gdb Relevant contents are automatically copied to gdb auto-load The directory , such gdb When it starts , These contents will be loaded automatically .
You can enter gdb After interactive command , adopt info auto-load To see the information .
Install well gdb After debugging the environment , Prepare a piece of code , Just use it gdb.
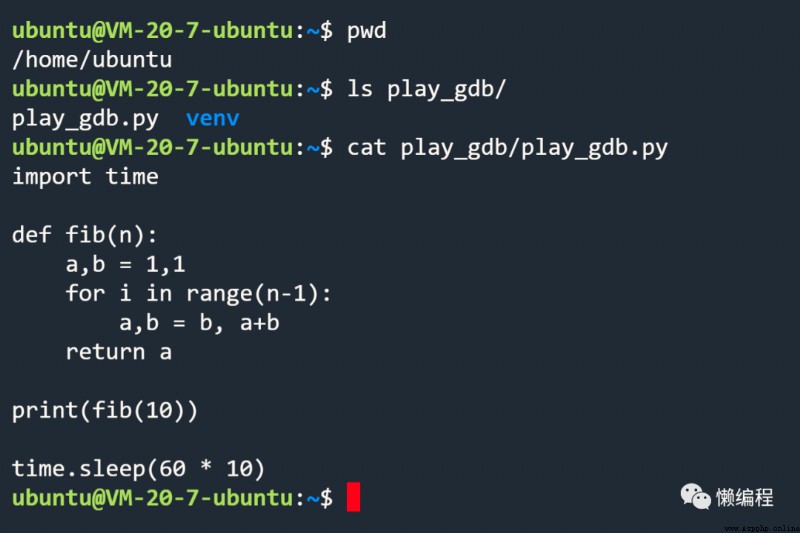
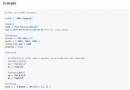
I am in the current user directory , Created play_gdb Directory and create a virtual environment in it , Then I created... In the directory play_gdb.py, Inside is a simple calculation of Fibonacci sequence code .
In daily development , We use it a lot python A virtual environment , So here I want to test , If we use python When running programs in a virtual environment ,gdb Whether it can be debugged normally .
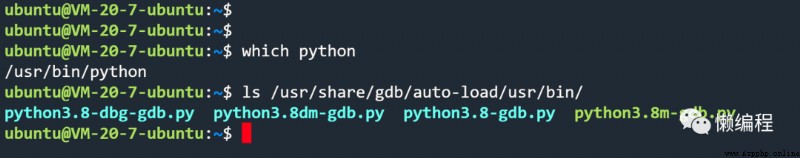
In the use of python venv front , Go through the system first python To have a try , Do not enter the virtual environment , Direct operation .
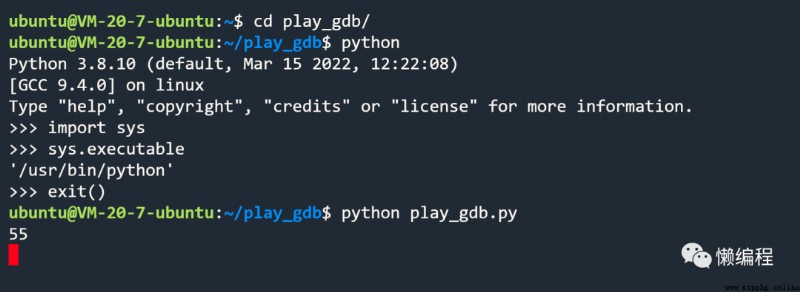
It can be seen from the figure above , We use the system python Run the program , Open a new window , adopt gdb debugged , Here's the picture :
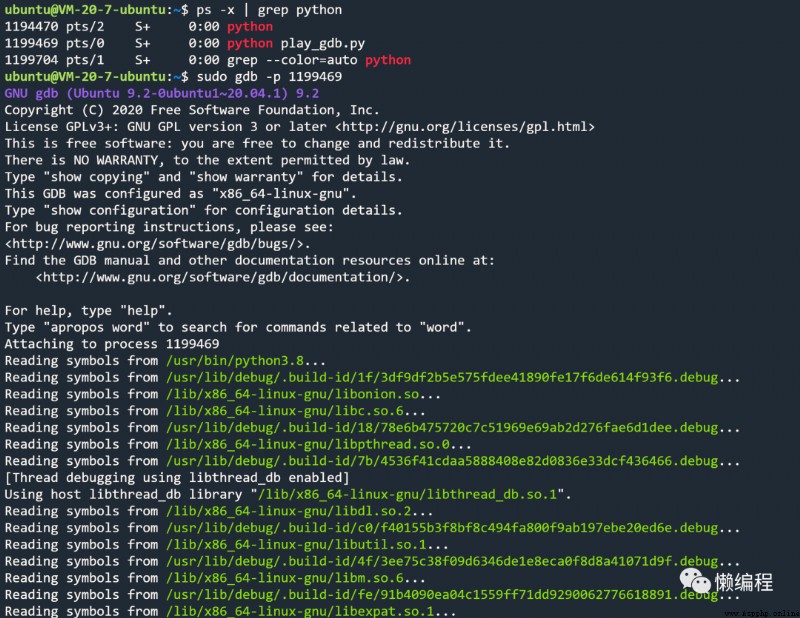
The above command is :
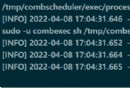
ps -x | grep python
sudo gdb -p 1199469
First find pid, And then let gdb Directly attached to the running python In progress .
adopt bt command , Check the call stack of the current program .
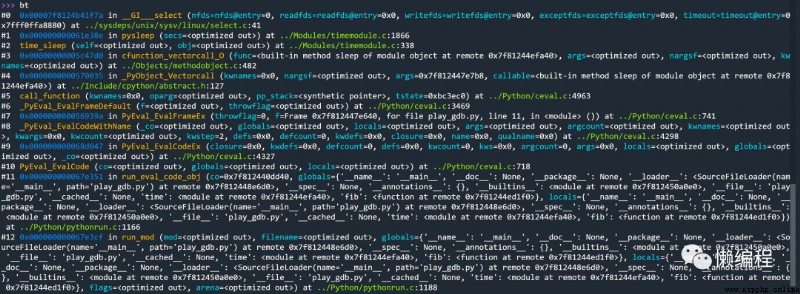
As can be seen from the above figure , There's a lot of python Interpreter level printing , We see that the program is currently python Of timemodule.c Of pysleep In the method , Finally called linux Systematic select.c( That is, through I/O Reuse related logic to realize python Of the main thread in the process sleep).
gdb Of bt The order can change c The call stack is printed out completely , If we just want to see python The call stack , have access to py-bt( You need to install python-dbg Ability to use ), Besides , If you want to view the current program py Code , have access to py-list( Equivalent pdb Of ll command ), Here's the picture :
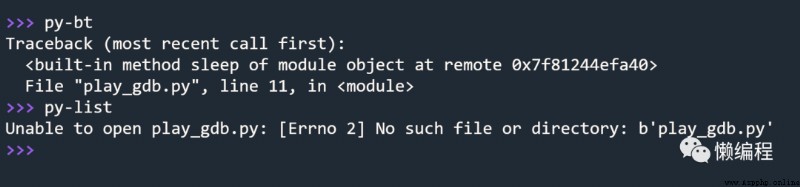
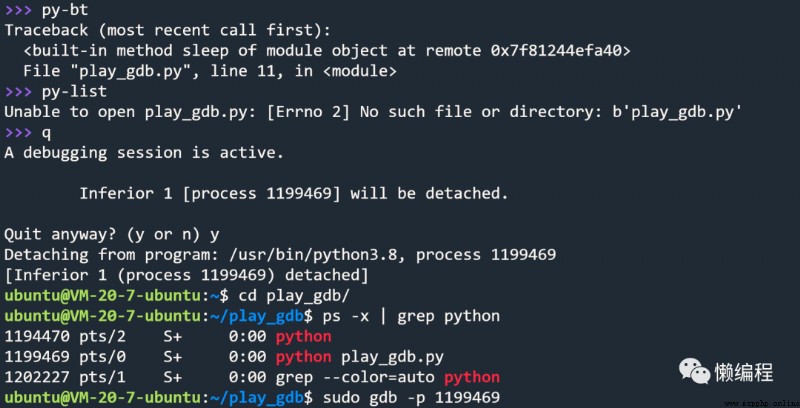
From the picture above ,py-bt and py-list It's not working , This is because we use gdb when , Not in the root directory of the current project , adopt q Command to quit , Then enter the project root directory , Reuse gdb Open the debug .

Make a brief list of gdb Common commands for debugging :
bt    #  At present C The call stack
py-bt  #  At present Py The call stack
py-list  #  At present py Code location
py-up  #  On a frame (py Level frame )
py-down  #  The next frame (py Level frame )
info thread   #  Thread information
thread <id>   #  Switch to a thread
thread apply all py-list  #  View all threads py Code location
ctrl-c  #  interrupt
More usage can be seen in pthon Official about gdb Documents :https://devguide.python.org/gdb/
If the use of python In virtual environment python The interpreter executes py Program ,gdb It can also be debugged normally , There is no difference in use .
adopt gdb-dashboard(https://github.com/cyrus-and/gdb-dashboard) Can beautify gdb Debugging information , To increase efficiency .
from gdb7 Start ,gdb It supports the use of Python Code to extend gdb,gdb-dashboard That's how it works .
In current use gdb Under the user directory of , download gdb-dashboard Provided .gdbinit file , You can go straight from github Middle pull , Then copy it to the corresponding user directory .
Then you install it again pygments, Used to enable syntax highlighting ( Optional installation ):
pip install pygmentsBecause I'm through root Users to use gdb Of , So we need to .gdbinit Put in root User directory .
Then use it normally gdb, You will get the following effect .
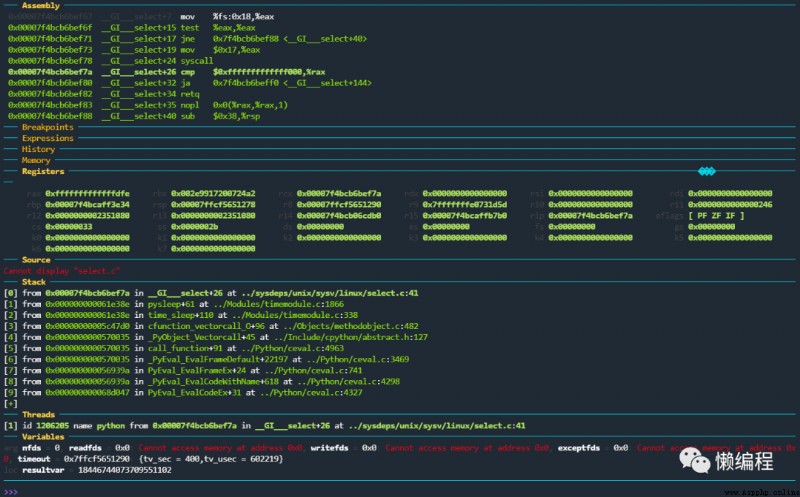
Above picture , You can visually see the call stack (Stack)、 Variable (Variables)、 register (Registers) Etc , All are c Level of .
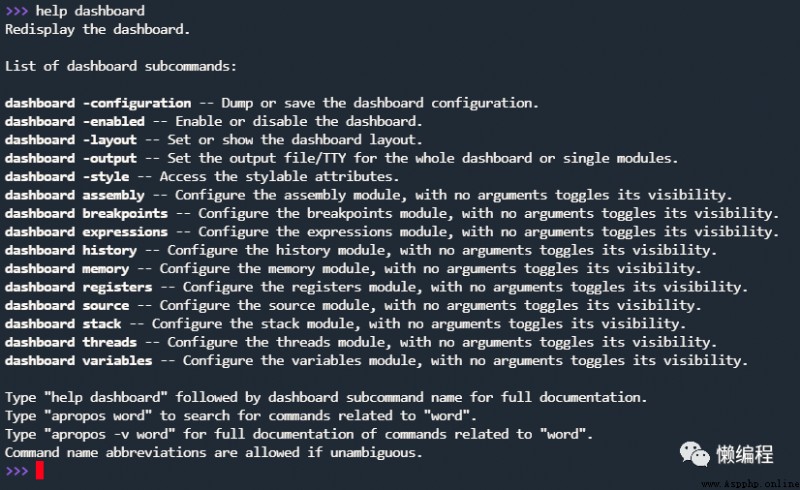
stay gdb in , adopt help dashboard You can see dashboard More usage .
master gdb debugging , Can better understand python Source code , For some difficult online situations , And more comfortable , Learn it .
Use gdb debugging CPython process (https://github.com/ictar/python-doc/blob/master/Others/%E4%BD%BF%E7%94%A8gdb%E8%B0%83%E8%AF%95CPython%E8%BF%9B%E7%A8%8B.md)
gdb debugging cpython(https://meteorix.github.io/2019/02/13/gdbpython/)