Python Basis of drawing


matplotlib Official website
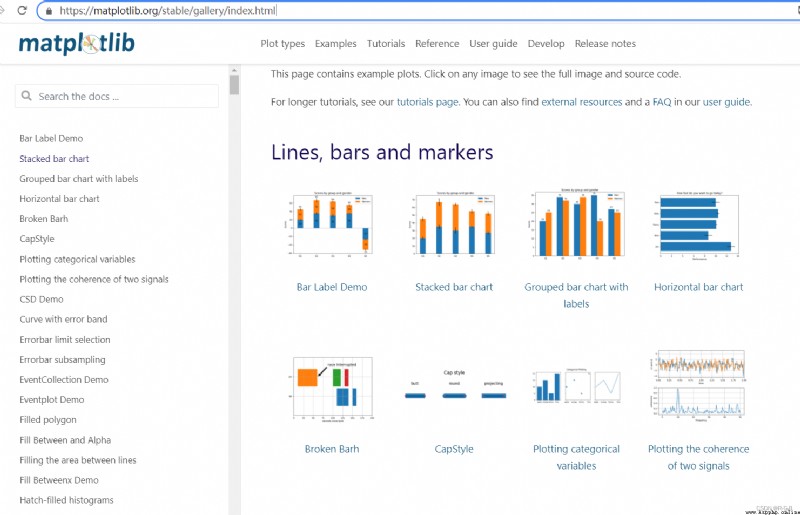
Click the required graph to see the implementation code 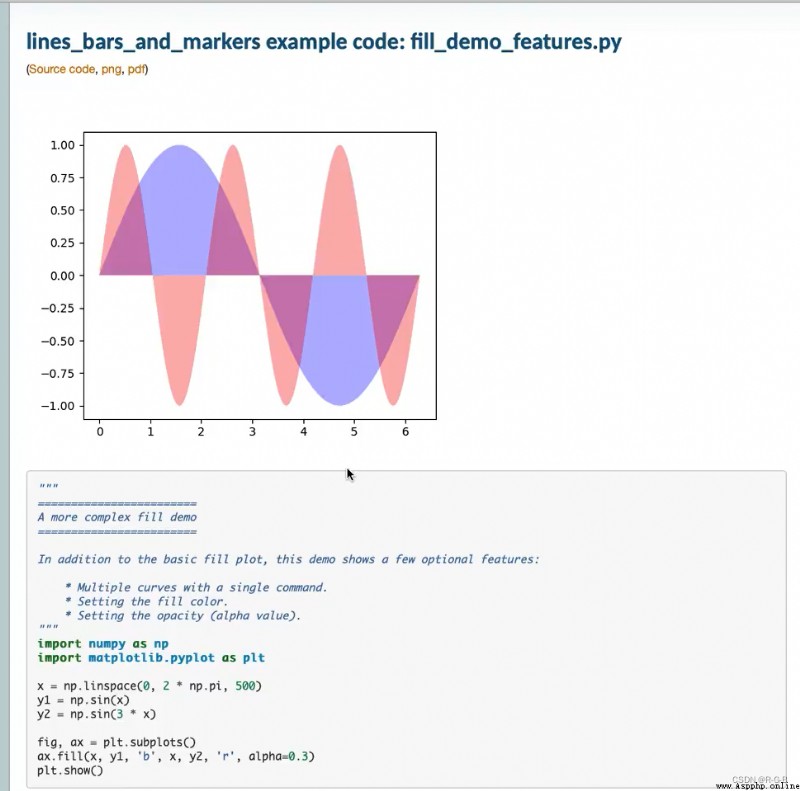


import numpy as np
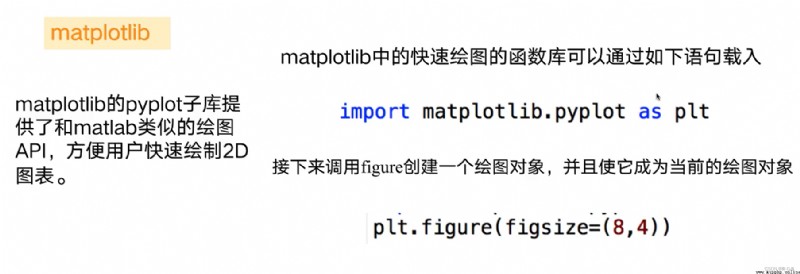
import matplotlib.pyplot as plt
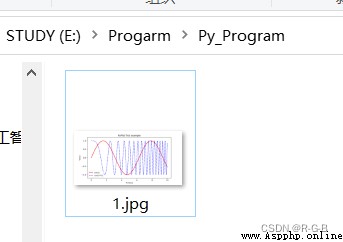
plt.figure(figsize=(8,4))
x=np.linspace(0,10,1000)
y=np.sin(x)
z=np.cos(x**2)
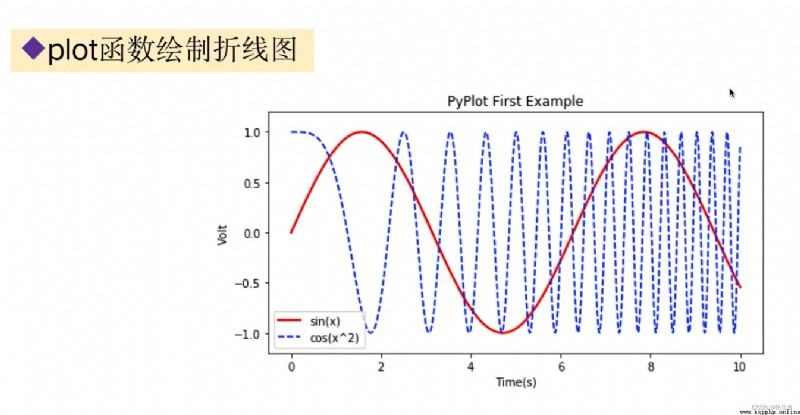
plt.plot(x,y,label="sin(x)",color="red",linewidth=2)
plt.plot(x,z,"b--",label="cos(x^2)")# b Blue ,-- Dashed line
plt.xlabel("Time(s)")
plt.ylabel("Value")
plt.title("PyPlot first example")
plt.ylim(-1.2,1.2)#y Axis range -1.2~1.2
plt.legend()# Figure note
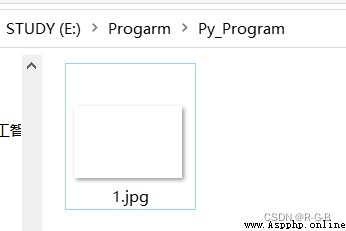
plt.savefig('E:/Progarm/Py_Program/1.jpg',dpi=300)# Save the picture ,dpi Save HD pictures , If not set dpi, Default computer resolution ( Pixels per inch )
plt.show()# If you want to save the picture , Must be in show Save before , If you put it in show after , A blank image is saved
If you want to save the picture , Must be in show Save before , If you put it in show after , A blank image is saved