本文實例講述了php使用Jpgraph繪制柱形圖的方法。分享給大家供大家參考。具體實現方法如下:
<?php
include ("src/jpgraph.php");
include ("src/jpgraph_bar.php");
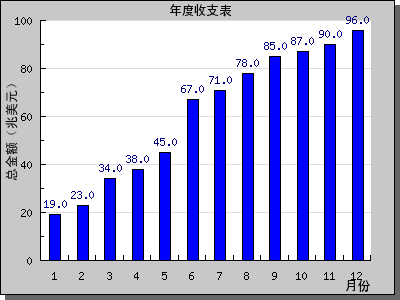
$data = array(19,23,34,38,45,67,71,78,85,87,90,96); //定義數組
$graph = new Graph(400,300); //創建新的Graph對象
$graph->SetScale("textlin");
$graph->SetShadow(); //設置陰影
$graph->img->SetMargin(40,30,20,40); //設置邊距
$barplot = new BarPlot($data); //創建BarPlot對象
$barplot->SetFillColor('blue'); //設置顏色
$barplot->value->Show(); //設置顯示數字
$graph->Add($barplot); //將柱形圖添加到圖像中
$graph->title->Set("年度收支表"); //設置標題和X-Y軸標題
$graph->xaxis->title->Set("月份");
$graph->yaxis->title->Set("總金額(兆美元)");
$graph->title->SetFont(FF_SIMSUN,FS_BOLD); //設置字體
$graph->yaxis->title->SetFont(FF_SIMSUN,FS_BOLD);
$graph->xaxis->title->SetFont(FF_SIMSUN,FS_BOLD);
$graph->Stroke();
?>
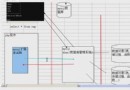
運行效果如下圖所示:
希望本文所述對大家的php程序設計有所幫助。