Applies to:
Oracle Server - Enterprise Edition - Version 9.2.0.1 to 11.1.0.6 [Release 9.2 to 11.1]
z*OBSOLETE: Microsoft Windows Server 2003
Microsoft Windows Itanium (64-bit)
z*OBSOLETE: Microsoft Windows XP (64-bit AMD64 and Intel EM64T)
Microsoft Windows Server 2003 (64-bit Itanium)Microsoft Windows Server 2003Microsoft Windows XP (64-bit AMD64 and Intel EM64T)
Periodic Database slowdowns seen in Windows 2003 environments with lots of memory, running Service Pack 1
Environments with a high level of concurrency, many CPU's and large amounts of physical ram are prone to this type of problem.
Symptoms include any or all of the following:
1. General slowdowns in the database, which may appear to be hung, even though systemstate dumps may not show evidence of hangs or locking contention. Sometimes, the database may recover from these slowdowns on its own, and begin responding with no user intervention. At other times, the database may appear to be hung for long periods of time.
2. Other symptoms may include slow disk I/O - i.e. a large increase in average I/O times may be observed when reviewing AWR reports covering the time period in question.
3. It may also be observed that network latency increases dramatically. If running in a RAC environment, you may notice an increase in cluster latency - i.e. an increase in the wait times for global cache requests and messages (again, as observed in AWR reports or in some cases as seen via real-time monitoring tools).
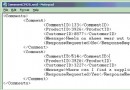
4. If running in a RAC environment, we may see IPC timeouts in the ipcdbg logfiles. On Oracle 10g, the ipcdbg logs are found in the $ORACLE_HOME\rdbms\log subdirectory. In Oracle 9i, the ipcdbg logs are found in C:\WINDOWS\system32\osd9i. Examples of entries in the ipcdbg logfiles that indicate a slowdown would be entries such as the following:
Thread(06c4): 10/25/07 05:59:56 TCP/IP IPC ErrorLog, version[ 10.2.0.2.0.99 ]

10/25/07 05:59:58 | INFO | 02dc | Initialized proc [oracle : opprodrc1 :####] from interface at#######

10/25/07 07:35:27 | ERROR | 1ae8 | IPC_TCPConnect: async connect err 10048 to [opp :####:###:#####]

10/25/07 07:38:44 | ERROR | 1c6c | IPC_TCPConnect: async connect err 10048 to [opp :###:###:#####]

10/25/07 07:43:37 | ERROR | 1414 | [ipcosd.c :####] IPC_TCPListen2: Timeout 63050 exceeds max 25000 + margin 5000

10/25/07 07:43:37 | ERROR | 1414 | [ipcosd.c :####] IPCInitPort: Timeout 63140 exceeds max 25000 + margin 5000

10/25/07 07:43:40 | ERROR | 15f0 | [ipcosd.c :####] IPC_TCPListen2: Timeout 64950 exceeds max 25000 + margin 5000
5. Monitoring of system resources via Perfmon or other monitoring utilities may also reveal an increase in system time, indicating a large amount of work being done by the OS kernel.
Diagnosing the problem:This problem can be difficult to diagnose, and it is therefore advised that the solution recommended below be implemented proactively. The symptoms listed in this note will not always manifest in the same way.
In some cases, this problem may be diagnosed by verifying via Perfmon stats, AWR reports, and ipcdbg logs as noted above. In order to get confirmation of the problem, as noted above, systemstate dumps may not show any symptoms other than slow processing, so it may be necessary to run adplus and take user level dumps of the oracle.exe process, in addition to collecting the normal systemstate dumps and hanganalyze dumps. Having a combination of systemsate dumps and adplus dumps of the oracle.exe process may make this issue easier to debug, but in some cases it may also be necessary to get a kernel dump to confirm the exact cause. The OS or Hardware vendor should be consulted for assistance in obtaining a kernel dump.
In order to take an adplus dump of the oracle.exe process, at a high level, you must install the 'Debugging Tools for Windows' and then run adplus as such:
adplus -hang -p
Be sure to use the correct PID corresponding to the correct oracle.exe. If you are running an ASM instance, you will most likely have at least two oracle.exe processes, but you will most likely want to run adplus and dump the oracle.exe associated with the database instance, NOT the ASM instance
For a complete description of what adplus is and how to run it, please refer to the following Microsoft Support note.
http://support.microsoft.com/kb/286350/en-us
@ For the issue described in the alert, the Adplus dumps of the oracle process may show threads
@ kiswapcontext
@ As noted above, in some cases, it may be necessary to take a
WorkaroundThe cause of this problem may be the following Microsoft bug, which is described in the following links:
http://support.microsoft.com/kb/919341
http://support.microsoft.com/kb/922658
This issue is known to be a problem in Windows 2003 with Service Pack 1, and can affect any application with large memory requirements, including single-instance Oracle database, Oracle RAC Databases and non-Oracle databases. It is strongly advised that this Windows hotfix be installed proactively on all Oracle installations running on Windows 2003 with Service Pack 1, or that those installations be upgraded to Service Pack 2 proactively.
PatchesMicrosoft has a hotfix available on top of Service Pack 1, and the issue should also be resolved by upgrading to Service Pack 2. As noted above, see the following referenced Microsoft article for information on this fix:
http://support.microsoft.com/kb/919341/en-us