最近看了看MySQL的狀態變量,感覺好多跟以前自己想象的不一樣。為了以後能及時發現自己的錯誤,就先記下來;
http://dev.MySQL.com/doc/refman/5.1/en/server-status-variables.Html
MySQL> show status;
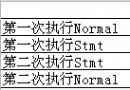
Com_xxx 語句計數變量表示每個xxx 語句執行的次數。每類語句有一個狀態變量。例如,Com_delete和Com_insert分別統計DELETE 和INSERT語句執行的次數。然而,如果一個查詢的結果是從查詢緩存中得到的,這會增加Qcache_hits,而不是Com_select Connections 4192
試圖連接到(不管是否成功)MySQL服務器的連接數。 Created_tmp_disk_tables 0 Created_tmp_files 5
MySQLd創建的臨時文件個數
Created_tmp_tables 1
服務器執行語句時在內存上自動創建的臨時表的數量,如果Created_tmp_disk_tables較大,你可能要增加tmp_table_size值使臨時 表基於內存而不基於硬盤。 Flush_commands 1
flush的執行個數 Handler_commit 0
Handler_delete 0
從 表中delete行的次數,此參數與 Com_delete不一樣,只要執行delete,Com_delete就會增加,而Handler_delete只有當在表中刪除了行的時候才增加。 如果delete刪除沒有影響到表裡的任何行,則不會增加Handler_delete值
Handler_discover 0
Handler_prepare 0
Handler_read_first 0
索引中第一條被讀的次數。這個表明。服務器正在進行全索引掃描 explain看的時候tpye類型為index
Handler_read_key 0
根據索引讀行的次數,如果較高,說明查詢使用了正確的表索引,explain看的時候tpye類型為const、eq_reg、ref、range、
Handler_read_next 0
根據鍵順序來讀取下一行,如果你使用索引范圍(range)或執行索引(index)掃描,該值增加,增加的大小為查出來的行數,一般order by 鍵值 該值增加
Handler_read_prev 0
根據鍵順序來讀取前一行, 基本上是用在ORDER BY ... DESC. 增加的大小為查出來的行數
Handler_read_rnd 0
根據固定位置讀一行的請求數,當需要對非鍵值排序時,該值會增加或者需要MySQL掃描整個表時,該值會增加,增加的大小為查出來的行數
Handler_read_rnd_next 0 (select * from mrhao_order_info where address like '%AA%' order by address ,這個值會導致Handler_read_rn增加7,Handler_read_rnd_next 而這個會增加103840,
而select * from mrhao_order_info where address like '%AA%' Handler_read_rnd_next 這個會增加103840,而Handler_read_rnd不會增加) Handler_rollback 0
Handler_savepoint 0
Handler_savepoint_rollback 0
Handler_update 0
Handler_write 132
(以上handler同Handler_delete,只有影響了表裡的任何行,才會增加該值) Innodb_buffer_pool_pages_data 491
Innodb_buffer_pool_pages_dirty 0
Innodb_buffer_pool_pages_flushed 6050
Innodb_buffer_pool_pages_free 0
Innodb_buffer_pool_pages_latched 0
Innodb_buffer_pool_pages_misc 21
Innodb_buffer_pool_pages_total 512
data 包含數據的頁數(髒或者干淨的)dirty 當前的髒頁數。flushed 刷新的頁數 free 空頁數
latched 鎖定的頁數(由於這個數據很號資源,所以UNIV_DEBUG 系統上編譯使用) misc分配給行鎖或者
hash索引管理用的頁數 total 是總的頁數 total=data+free+misc(5.4上 1頁=16k) Innodb_buffer_pool_read_ahead_rnd 3288
Innodb_buffer_pool_read_ahead_seq 31840
Innodb_buffer_pool_read_requests 3413220598
Innodb_buffer_pool_reads 104184
Innodb_buffer_pool_wait_free 0
Innodb_buffer_pool_write_requests 85786
read_ahead_rnd 表示在初始化innodb時,使用隨機預讀的個數,這個發生在對一個表有大量隨機掃描的查詢,read_ahead_seq 在初始化innodb時,使用順序預讀的個數,一般發生在全表順序掃描,(innodb有兩種預讀模式:隨機預讀方式跟順序預讀 http://dev.MySQL.com/doc/refman/5.0/en/innodb-disk-io.Html) read_requests 邏輯讀請求的個數,reads 不在buffer pool 不得不從磁盤讀取的邏輯請求個數,wait_free,一般情況下,在後台像innodb buffer pool寫,然後,當需要讀或者創建時,而又沒有干淨的頁使用時,就需要等待頁面刷新,這個狀態就是等待實例進行計數, write_requests 為往buffer pool寫入的個數 Innodb_data_fsyncs 32146
Innodb_data_pending_fsyncs 0
Innodb_data_pending_reads 0
Innodb_data_pending_writes 0
Innodb_data_read 1418334208
Innodb_data_reads 146431
Innodb_data_writes 34452
Innodb_data_written 212622848
read 從服務器開啟以來,innodb讀取的字節數。reads 服務器讀取的頁數 ,written innodb寫入的字節數 writes 服務器寫入的頁數(1頁16K)fsyncs fsyncs()操作數,pending_fsyncs 掛起的fsyncs()操作數 pending_reads 掛起的讀 pending_writes掛起的寫 Innodb_dblwr_pages_written 6050
Innodb_dblwr_writes 3324
pages_written 雙寫操作已經寫好的頁數。 writes 已經執行的雙寫操作數量 Innodb_log_waits 0
Innodb_log_write_requests 2617
Innodb_log_writes 22335
Innodb_os_log_fsyncs 25566
Innodb_os_log_pending_fsyncs 0
Innodb_os_log_pending_writes 0
Innodb_os_log_written 12722176 Innodb_page_size 16384
Innodb_pages_created 13
Innodb_pages_read 610723
Innodb_pages_written 6050
size編譯時,頁的大小,一般為16K created 新建的頁數 read 讀的頁數 written 寫的頁數 Innodb_row_lock_current_waits 0
Innodb_row_lock_time 0
Innodb_row_lock_time_avg 0
Innodb_row_lock_time_max 0
Innodb_row_lock_waits 0
Innodb_rows_deleted 91
Innodb_rows_inserted 824
Innodb_rows_read 1155270834
Innodb_rows_updated 337
deleted 刪除的行數 inserted 插入的行數 read掃描時的行數(測試發現不是讀取的行數) updated跟新的行數 以上數據只對innodb引擎,而com_ handler_是對所有引擎 Key_blocks_not_flushed 0
Key_blocks_unused 7150
Key_blocks_used 211
Key_read_requests 872516
Key_reads 4553
Key_write_requests 7498
Key_writes 3768
Key_blocks_not_flushed 在 key cache中修改了,但是還沒有刷新到磁盤上的塊數,Key_blocks_unused 未使用的塊數(key_buffer控制),
Key_blocks_used 使用的塊數Key_read_requests 從cache中讀取的請求數,Key_reads 從磁盤讀取的塊數,用Key_reads/Key_read_requests來計算cache的miss rate
Key_write_requests 寫入cache的請求數,Key_writes 寫入磁盤的塊數
(注: 內存與磁盤交互的是塊數,而cache的請求數為操作的行數。myisam 中data 與index是文件是分離的,當insert 數據的時候,myisam會直接插入數據到磁盤,但不會立即插入index到磁盤上,而是直接插入key_buffer中,而不刷新到磁盤上,所以有時候 Key_blocks_not_flushed 與Key_write_requests 可能會很高,但Key_writes 確很低,可用“flush table 表名” 強制刷新index到磁盤上。如果大量的塊沒有flush到磁盤上,若服務器這時候出現故障,myisam會在下次重啟時,根據data文件重建 index文件,若沒有重建成功,可用”repair table 表名“修理表 ) Last_query_cost 0.000000
查詢優化器計算的最後編譯的查詢的總成本,這個在對於同一語句,來對比不同優化器很有用,默認為0,該變量為session變量
Max_used_connections 22 Not_flushed_delayed_rows 0
等待寫入INSERT DELAY隊列的行數 Open_files
Open_streams
Open_table_definitions
Open_tables
Opened_files
Opened_table_definitions
Opened_tables
Open_files 打開文件的個數,這個統計是服務器打開的正規文件的個數。不包括socket 及pipe。當打開myisam表數據時,他會增加兩個(數據文件與索引文件),當打開innodb表時,該值不增加,當打開的myisam表已另一個別 名打開時,Open_files只會增加一個。flush tables 會清空該值
Opened_files,當增加Open_files同時,他會已同樣大小增加該值。當table_open_cache增加,或者flush tables 時,該值是不會減少,但也不增加的。
Open_table_definitions 打開表時被cache的frm文件個數。
Open_tables 打開表的個數。
Opened_table_definitions 與 Opened_tables 的解釋與Opened_files差不多(跟網上說的只有當
table cache 到達table_open_cache時,才會增加Opened_files這值不一樣哦),以上狀態有global 跟session Prepared_stmt_count 0
當前prepared statements的個數,最大數會由變量max_prepared_stmt_count控制 ,當DEALLOCATE PREPARE時,改狀態值會減小 Qcache_free_blocks 0
Qcache_free_memory 0
Qcache_hits 0
Qcache_inserts 0
Qcache_lowmem_prunes 0
Qcache_not_cached 0
Qcache_querIEs_in_cache 0
Qcache_total_blocks 0
Qcache_total_blocks 顯示了所有的塊數(未使用的內存跟已使用),而Qcache_free_blocks 反映了未使用的塊數。如果Qcache_free_blocks很大(如果沒有內存碎片的話,應該為1),說明內存的碎片很多,內存的使用率會比較差,所 以這時雖然 Qcache_free_memory顯示還有剩余的內存,也可能無法使用,當插入新的query時就需要清除舊的,使得 Qcache_lowmem_prunes很高。可以使用
flush query cache重整內存,操作之後Qcache_free_blocks應該為1,因為所有未使用的內存都放在一起作為連續的一塊了 QuerIEs
被服務器執行的語句個數,包括存儲過程裡的語句,也包括show status之類的
Questions 19483094
被服務器執行的語句個數, 但是不包括存儲過程裡面的語句 Rpl_status NULL (暫時未使用) Select_full_join 0
Select_full_range_join 0
Select_range 0
Select_range_check 0
Select_scan 1
有興趣可以看看下面內容
http://hackMySQL.com/selectandsort
在優化器explain中,顯示的第一個表或者唯一的一個表他會影響: Select_scan and Select_range,
第二個表或子表會影響: Select_full_join, Select_range_check, and Select_full_range_join
show session status like "select%";的值會按照以下規則來增加
1;Select_scan 當順序的從磁盤讀取時,會增加該值,如explain中第一個表的type" 列顯示ALL
EXPLAIN select * from t1,t2
2:Select_range 當explain中第一個表的type" 列顯示range時,該值增加
EXPLAIN select * from t1,t2 where t1.c1>7800 and t1.c1<8000 and t1.c1=t2.c1
3:Select_full_join explain當第二個表或子表的“type" 列顯示ALL
EXPLAIN select * from t1,t2 where t1.c1>7800 and t1.c1<8000 and t1.c2=t2.c2
4:Select_full_range_join explain的第二個表或子表為range時 該值增加
EXPLAIN select * from t1,t2 where t1.c1>7800 and t1.c1<8000 and t2.c1<1000 這個會增加Select_full_range_join 及Select_range
5:Select_range_check 的意思是不確定range的范圍,
如:EXPLAIN select * from t2,t1 where t2.c1<t1.c2;第二個表顯示:Range checked for each record (index map: 0x1)
Sort_merge_passes 0
Sort_range 0
Sort_rows 0
Sort_scan 0
一般的,查詢sort都會經歷三個步驟
1. 查找where條件的值
2. 排序值
3. 讀排序後的行
當在第一步時增加Select_scan, 則第三步就會是 增加Sort_scan. 如果第一步是增加 Select_range,則第三步就是 增加Sort_range.
Sort_merge_passes 包括兩步。MySQL 首先會嘗試在內存中做排序,使用的內存大小由系統變量 Sort_buffer_size 決定,如果它的大小不夠把所有的記錄都讀到內存中,MySQL 就會把每次在內存中排序的結果存到臨時文件中,這時候會增加Sort_merge_passes。等 MySQL 找到所有記錄之後,再把臨時文件中的記錄做一次排序。實際上,MySQL 會用另一個臨時文件來存再次排序的結果,所以通常會看到 Sort_merge_passes 增加的數值是建臨時文件數的兩倍。因為用到了臨時文件,所以速度可能會比較慢,增加 Sort_buffer_size 會減少 Sort_merge_passes 和 創建臨時文件的次數。但盲目的增加 Sort_buffer_size 並不一定能提高速度, Slave_open_temp_tables 0
Slave_retrIEd_transactions 0
Slave_running OFF Slow_launch_threads 0
The number of threads that have taken more than slow_launch_time seconds to create.
Slow_querIEs 0
The number of querIEs that have taken more than long_query_time seconds. Table_locks_immediate 24364829
Table_locks_waited 0
Table_locks_immediate 立即獲得的表的鎖的次數。
Table_locks_waited 不能立即獲得的表的鎖的次數。 Threads_cached 0
Threads_connected 12
Threads_created 4191
Threads_running 1
Threads_cached 線程的緩存值,
Threads_connected 當前打開的連接的數量。
Threads_created 創建用來處理連接的線程數。如果Threads_created較大,你可能要增加thread_cache_size值。緩存訪問率的計算方法 Threads_created(新建的線程)/Connections(只要有線程連接,該值就增加)。
Threads_running 激活的(非睡眠狀態)線程數。 Uptime 978671
The number of seconds that the server has been up.
Uptime_since_flush_status 978671
The number of seconds since the most recent FLUSH STATUS statement(FLUSH STATUS,是把當前的session值加到global上,並重置key-cache及把Max_used_connections值變為當前的連接 數).