Hough變換的原理:
將圖像從圖像空間變換至參數空間,變換公式如下:
![]()
變換以後,圖像空間與參數空間存在以下關系:
圖像空間中的一點在參數空間是一條曲線,而圖像空間共線的各點對應於參數空間交於一點的各條曲線。
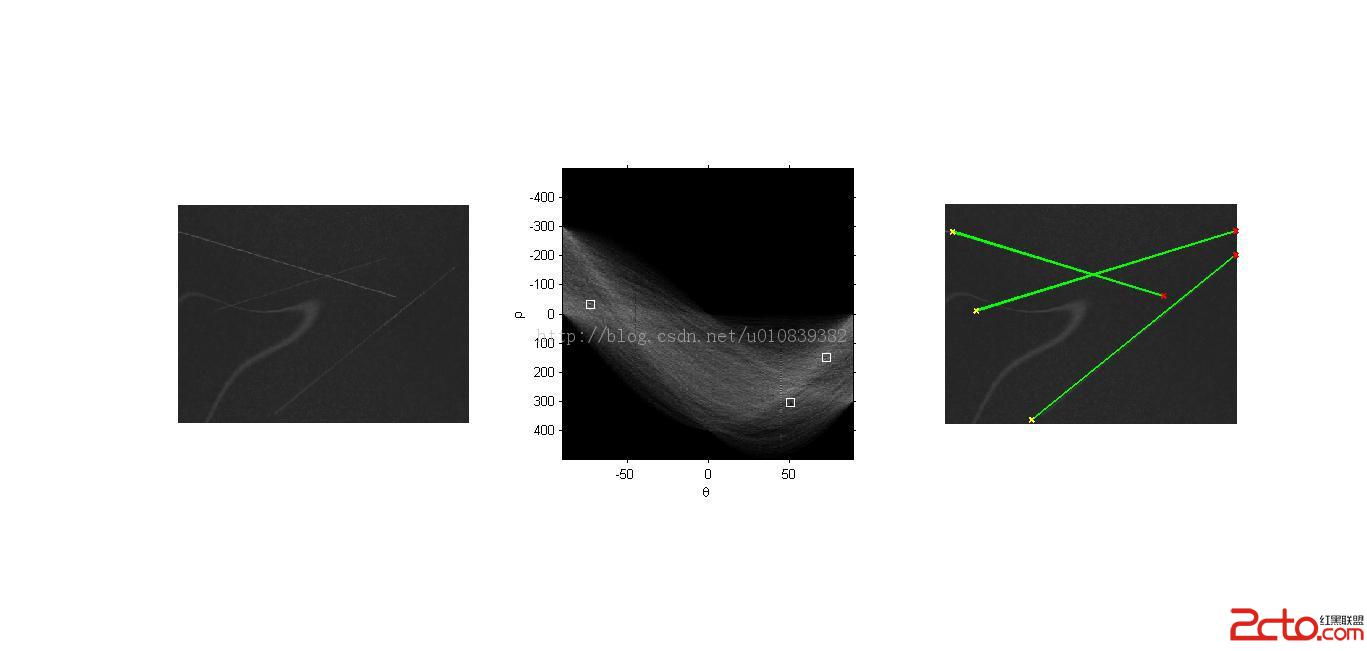
下面使用Matlab實現Hough變換對圖像中的直線劃痕進行檢測。
close all;
clear all;
I  = imread('scratch.tif');
figure;
subplot(1,3,1);
imshow(I);
BW = edge(I,'canny');%Canny方法提取圖像邊界,返回二值圖像(邊界1,否則0)
[H,T,R] = hough(BW);%計算二值圖像的標准霍夫變換,H為霍夫變換矩陣,I,R為計算霍夫變換的角度和半徑值
subplot(1,3,2);
imshow(H,[],'XData',T,'YData',R,'InitialMagnification','fit');%hough變換的圖像
xlabel('\theta'), ylabel('\rho');
axis on,axis square,hold on;
P  = houghpeaks(H,3);%提取3個極值點
x = T(P(:,2));
y = R(P(:,1));
plot(x,y,'s','color','white');%標出極值點
lines=houghlines(BW,T,R,P);%提取線段
subplot(1,3,3);
imshow(I), hold on;
for k = 1:length(lines)
xy = [lines(k).point1; lines(k).point2];
 plot(xy(:,1),xy(:,2),'LineWidth',2,'Color','green');%畫出線段
plot(xy(1,1),xy(1,2),'x','LineWidth',2,'Color','yellow');%起點
plot(xy(2,1),xy(2,2),'x','LineWidth',2,'Color','red');%終點
end