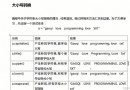
Sometimes you need to draw multiple curves, and you need to draw multiple times. You can add handles to the curve drawing, then put the handles into variables, and then add legends to the saved handles.
Look at the picture
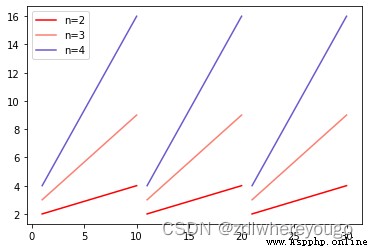
Look at the code
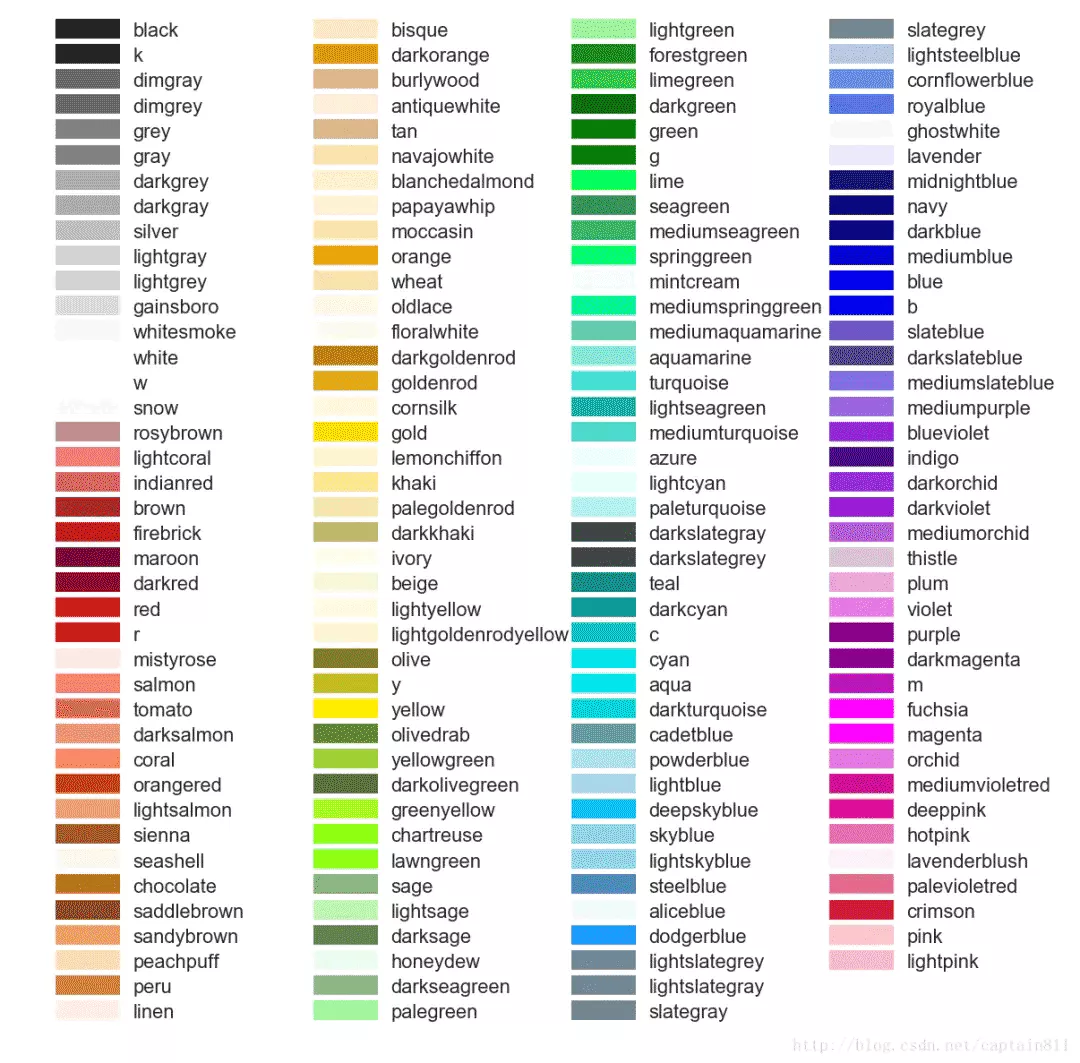
import matplotlib.pylab as pltdef get_v_value(t):t2=t*treturn t2if __name__ == '__main__':cycllist=[2,3,4]pllist=[]lgtextlist=[]fig1=plt.figure()colorlsit = ['red', 'salmon', 'slateblue', 'cyan', 'olive', 'purple', 'bisque']icolor=0for cycle in cycllist:htlist=[[1,10],[11,20],[21,30]]for thv in htlist:tmp = [cycle, get_v_value(cycle)]p1, = plt.plot([thv[0], thv[1]], tmp, color=colorlsit[icolor])icolor = icolor + 1labeltext = 'n=' + str(cycle)pllist.append(p1)lgtextlist.append(labeltext)plt.legend(pllist, lgtextlist)plt.show() Python. Iterator object iter() (Based on the iterator feature, dismantle the complicated single-line forced code, and understand the secret method for selecting fixed-length elements of the sequence.)
Python 官網: python https://www.