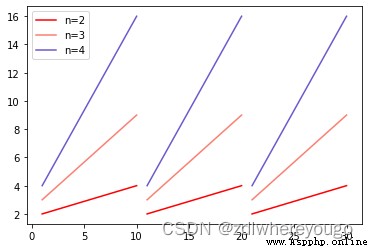
有時候需要繪制多段曲線,還需要繪制多次,可以給曲線繪圖增加句柄,然後把句柄放到變量裡面,然後對保存起來的句柄分別添加圖例。
看圖
看碼
import matplotlib.pylab as plt
def get_v_value(t):
t2=t*t
return t2
if __name__ == '__main__':
cycllist=[2,3, 4]
pllist=[]
lgtextlist=[]
fig1=plt.figure()
colorlsit = ['red', 'salmon', 'slateblue', 'cyan', 'olive', 'purple', 'bisque']
icolor=0
for cycle in cycllist:
htlist=[[1,10],[11,20],[21,30]]
for thv in htlist:
tmp = [cycle, get_v_value(cycle)]
p1, = plt.plot([thv[0], thv[1]], tmp, color=colorlsit[icolor])
icolor = icolor + 1
labeltext = 'n=' + str(cycle)
pllist.append(p1)
lgtextlist.append(labeltext)
plt.legend(pllist, lgtextlist)
plt.show()