Today I will show you how to use itPython來操作Excel文件,The module that needs to be used is called openpyxl,Among them, we will cover some basic routine operations,例如有
Insert and query data
分類統計數據
數據的可視化
Change of font color
等等
The dataset used in this tutorial,可以在公眾號後台回復【20220802】獲取哦!
By default, everyone has already installed itopenpyxl模塊了,要是還沒有安裝的話,可以通過pip命令行,代碼如下
pip install openpyxlLet's import firstExcel數據集,代碼如下
# 導入模塊
from openpyxl import Workbook, load_workbook
# 導入Excel數據集
wb = load_workbook(r"grades.xlsx")
# Get a working sheet
sheet = wb.active
# The name of the worksheet is called
print(sheet)
output
<Worksheet "Class A">We print the value by passing in the cell's location,代碼如下
print(sheet["A1"].value)
print(sheet["A2"].value)
print(sheet["B3"].value)
output
Name
Test
MaleWe can also try to change the value of a cell,代碼如下
sheet["A1"] = "Dylan"
# 保存
wb.save(r"grades.xlsx")
after saving,我們來看一下結果如何,如下圖所示
We try the existing onesExcelAdd a worksheet to it,代碼如下
# 添加一個新的工作表
wb.create_sheet("Class B")
# Returns a list with sheet names
print(wb.sheetnames)
output
['Class A', 'Class B']Let's try to create a new workbook,And insert several pieces of data,代碼如下
# 創建一個新的工作簿
new_wb = Workbook()
ws = new_wb.active
# Rename the worksheet's name
ws.title = "Test1"
# Insert data into the newly created worksheet
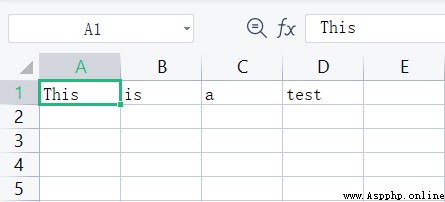
ws.append(["This","is","a","test"])
new_wb.save("test.xlsx")Let's take a look at the final result,如下圖所示
Let's try to insert a few more pieces of data,代碼如下
# Insert more data
ws.append(["This","Is","Another","Test"])
ws.append(["And","Yet","Another","Test"])
ws.append(["End"])
# 保存
new_wb.save("test.xlsx")If you want to insert a row,調用的則是insert_rows()方法,具體代碼如下
# 前面的步驟一樣,Import workbooks and data
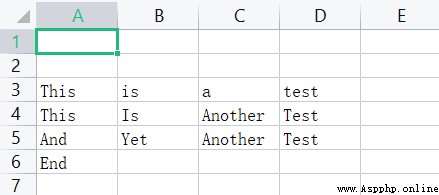
ws.insert_rows(1)
wb.save("test.xlsx")The result is shown in the figure below
同理,If you want to delete a row of data,調用的則是delete_rows()方法,具體代碼如下
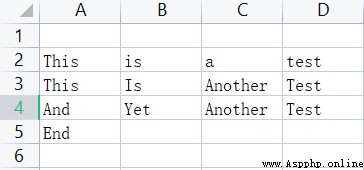
ws.delete_rows(1)
# 保存
wb.save("test.xlsx")
The result is shown in the figure below
Let's see how to insert and delete columns,The way to insert a column isinsert_cols(),代碼如下
# Insert a new column
ws.insert_cols(2)
結果如下
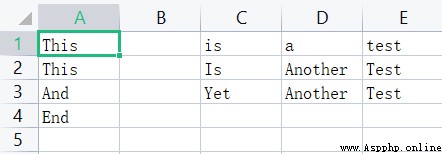
And the way to delete a column isdelete_cols(),
ws.delete_cols(1,2)We can also conduct a series of statistical analysis of data,First, let's put the data we need to use into itExcel當中去,
sales_data = {
"蘋果": {"北京": 5000, "上海": 7000, "深圳": 6000, "香港": 10000},
"華為": {"北京": 8000, "上海": 4000, "深圳": 3000, "香港": 9000},
"小米": {"北京": 6000, "上海": 9000, "深圳": 5000, "香港": 6000},
"vivo": {"北京": 3000, "上海": 5000, "深圳": 4000, "香港": 7000}
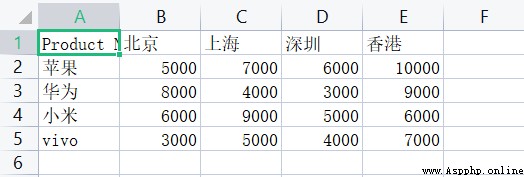
}I randomly generated some data,並且將其放置到Excel當中去,代碼如下
# 創建一個新的工作簿
sales_wb = Workbook()
ws = sales_wb.active
# Rename the worksheet's name
ws.title = "Sales"
# 創建列名
column_names = ["Product Name"] + list(sales_data["蘋果"].keys())
ws.append(column_names)
# Put a series of values into the worksheet
for product in sales_data:
sales = list(sales_data[product].values())
ws.append([product] + sales)
sales_wb.save("sales_data.xlsx")我們來看一下出來的結果,如下圖所示
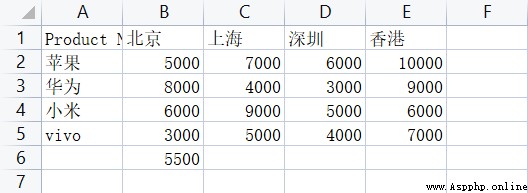
Let's specify a column,and find the average value,代碼如下
ws['B6'] = '=AVERAGE(B2:B5)'
sales_wb.save("sales_data.xlsx")
我們來看一下出來的結果,如下圖所示
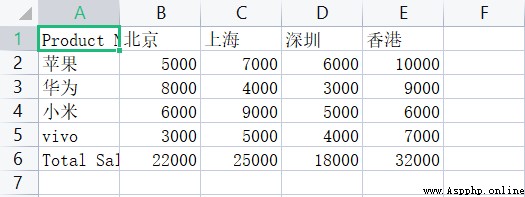
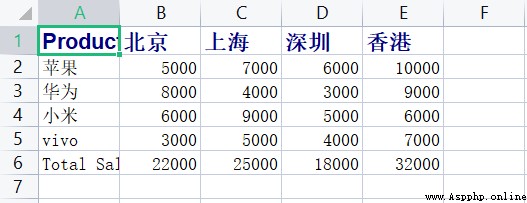
We do a summation calculation for each city's sales,我們寫一個forLoop to iterate over each column,Sum the data in each column,代碼如下
# Add the name of a new line
ws['A' + str(ws.max_row + 1)] = "Total Sales"
# traverse and sum
for col in range(2, len(sales_data["蘋果"]) + 2):
    char = get_column_letter(col)
    ws[char + '6'] = f"=SUM({char + '2'}:{char + '5'})"
我們來看一下出來的結果,如下圖所示
We can also change the font color,Make it more beautiful,代碼如下
for col in range(1,ws.max_column+1):
    ws[get_column_letter(col) + '1'].font = Font('Arial', bold=True, size=13, color='00000080')

sales_wb.save("sales_data.xlsx")
Let's take a look at the result after beautification,如下圖所示
最後的最後,Let's draw a histogram,Let's take a look at the sales figures for different products in each city,The product category corresponding to the abscissa,The vertical axis corresponds to the sales data,In addition, we will use different colors to mark them according to different cities,代碼如下
from openpyxl.chart import BarChart, Reference
# Create a new histogram instance
barchart = BarChart()
# 確定數據的范圍
data = Reference(ws, min_col=ws.min_column+1, max_col=ws.max_column, min_row=ws.min_row, max_row=ws.max_row-1)
categories = Reference(ws, min_col=ws.min_column, max_col=ws.min_column, min_row=ws.min_row+1, max_row=ws.max_row-1)
# Add data and categories
barchart.add_data(data, titles_from_data=True)
barchart.set_categories(categories)
# Where to put the plotted data
ws.add_chart(barchart, "G1")
# 添加標題
barchart.title = 'Product sales data for each city'
# 圖表的類型
barchart.style = 2
sales_wb.save("sales_data.xlsx")
Let's take a look at the final result,如下圖所示

NO.1
往期推薦
Historical articles
【Python自動化辦公】分享幾個好用到爆的模塊,建議收藏!
【干貨原創】發現了一個好用到爆的數據分析利器
Python辦公軟件自動化,5分鐘掌握openpyxl操作
用Python制作可視化GUI界面,一鍵實現多種風格的照片處理
分享、收藏、點贊、在看安排一下?