前些天發現了一個巨牛的人工智能學習電子書,通俗易懂,風趣幽默,無廣告,忍不住分享一下給大家.(點擊跳轉人工智能學習資料)
說明:若需要數據附件及python源文件請移步微信公眾號“創享日記”,聯系作者有償獲取!
一、題目
附件drug. order_ detai 1.xlsxis the sales data of a chain pharmacy,請使用pandas和numpyAnalyze pharmacy business data:
(1)read attachmentexcel文件drug._order_detail_1.xlsx 中的數據;
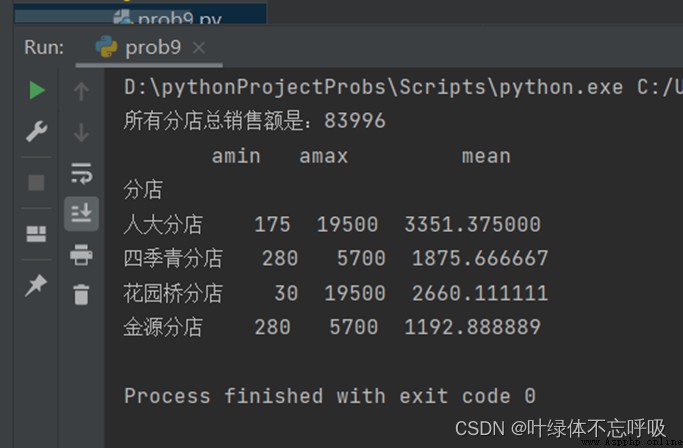
(2)Calculate the total sales for all branches and print out;
(3)增加“銷售額”列,其中,銷售額=價格*銷量;
(4)The minimum value of sales of different branches by branch、最大值、平均值、並打印輸出;
(5)輸出效果如下所示,其中,*The numbers represent specific statistics.
二、題目分析
對於Excel文件的處理,常見的就是pandas庫,我們引入pandasPass after the libraryread_excelmethod can read the specifiedExcel文件,Attention is to specifysheet的名稱.Then we convert it to DataFrame類型進行計算.Then we calculate the total sales of all branches,Just loop through all branches,Then multiply that row's sales by that row's unit price,Then each addition gives the result,然後通過print進行輸出.然後添加列,其實有一種簡單的方法,就是當你df[‘銷售額’]的時候,系統檢測到ExcelThere is no sales column in the file,Then it will be added automatically,Then just specify its value to multiply the corresponding price by the sales volume.之後通過numpy的min,max和meanThe function can easily find the maximum, minimum and average values.
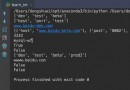
三、代碼
import pandas as pd
import numpy as np
import xlrd
data=pd.read_excel('drug_order_detai_1.xlsx',sheet_name='drug_order_detail2')
df=pd.DataFrame(data)
row,col=df.shape
sum=0
list=[]
for i in range(0,row):
sum+=int(df.loc[i]['銷量'])*int(df.loc[i]['價格'])
print("The total sales of all branches is :"+str(sum))
df['銷售額'] = df['價格'] * df['銷量']
print(pd.DataFrame(df.groupby('分店')['銷售額'].agg([np.min,np.max,np.mean])))
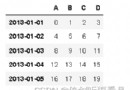
四、實驗結果