安裝Prometheus
sudo groupadd --system prometheus
sudo useradd -s /sbin/nologin --system -g prometheus prometheus
sudo mkdir /var/lib/prometheus
Prometheus primary configuration files directory is /etc/prometheus/. It will have some sub-directories:
for i in rules rules.d files_sd; do sudo mkdir -p /etc/prometheus/${i}; done
sudo apt update
sudo apt -y install wget curl vim
mkdir -p /tmp/prometheus && cd /tmp/prometheus
curl -s https://api.github.com/repos/prometheus/prometheus/releases/latest | grep browser_download_url | grep linux-amd64 | cut -d '"' -f 4 | wget -qi -
Extract the file:
tar xvf prometheus*.tar.gz
cd prometheus*/
Move the binary files to /usr/local/bin/ directory.
sudo mv prometheus promtool /usr/local/bin/
Check installed version:
prometheus --version
Move Prometheus configuration template to /etc directory.
sudo mv prometheus.yml /etc/prometheus/prometheus.yml
Also move consoles and console_libraries to /etc/prometheus directory:
sudo mv consoles/ console_libraries/ /etc/prometheus/
cd $HOME
sudo vim /etc/prometheus/prometheus.yml
# my global config
global:
scrape_interval: 15s # Set the scrape interval to every 15 seconds. Default is every 1 minute.
evaluation_interval: 15s # Evaluate rules every 15 seconds. The default is every 1 minute.
# scrape_timeout is set to the global default (10s).
# Alertmanager configuration
alerting:
alertmanagers:
- static_configs:
- targets:
# - alertmanager:9093
# Load rules once and periodically evaluate them according to the global 'evaluation_interval'.
rule_files:
# - "first_rules.yml"
# - "second_rules.yml"
# A scrape configuration containing exactly one endpoint to scrape:
# Here it's Prometheus itself.
scrape_configs:
# - job_name: django
# scrape_interval: 10s
# static_configs:
# - targets:
# - localhost:8000
- job_name: app1
scrape_interval: 10s
static_configs:
- targets:
- 192.168.1.32:4040 #這個是nginx log監聽
# The job name is added as a label `job=<job_name>` to any timeseries scraped from this config.
- job_name: "prometheus"
# metrics_path defaults to '/metrics'
# scheme defaults to 'http'.
static_configs:
- targets: ["localhost:9090"]
sudo tee /etc/systemd/system/prometheus.service<<EOF
[Unit]
Description=Prometheus
Documentation=https://prometheus.io/docs/introduction/overview/
Wants=network-online.target
After=network-online.target
[Service]
Type=simple
User=prometheus
Group=prometheus
ExecReload=/bin/kill -HUP \$MAINPID
ExecStart=/usr/local/bin/prometheus \
--config.file=/etc/prometheus/prometheus.yml \
--storage.tsdb.path=/var/lib/prometheus \
--web.console.templates=/etc/prometheus/consoles \
--web.console.libraries=/etc/prometheus/console_libraries \
--web.listen-address=0.0.0.0:9090 \
--web.external-url=
SyslogIdentifier=prometheus
Restart=always
[Install]
WantedBy=multi-user.target
EOF
Change directory permissions.
Change the ownership of these directories to Prometheus user and group.
for i in rules rules.d files_sd; do sudo chown -R prometheus:prometheus /etc/prometheus/${
i}; done
for i in rules rules.d files_sd; do sudo chmod -R 775 /etc/prometheus/${
i}; done
sudo chown -R prometheus:prometheus /var/lib/prometheus/
Reload systemd daemon and start the service:
sudo systemctl daemon-reload
sudo systemctl start prometheus
sudo systemctl enable prometheus
sudo ufw allow 9090/tcp
visit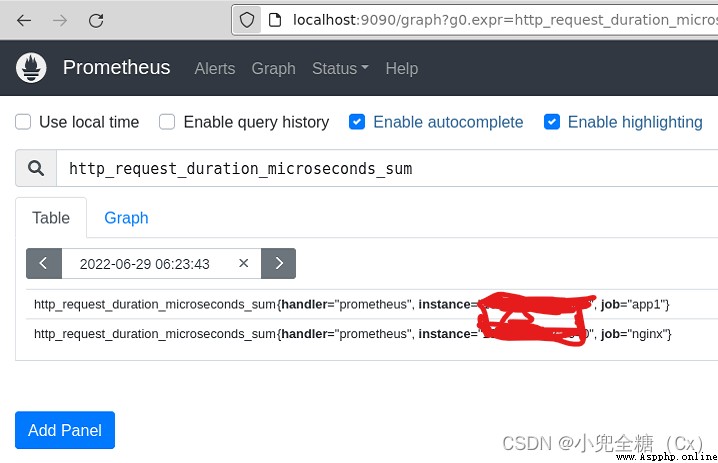
配置django
配置Nginx exporter
https://github.com/martin-helmich/prometheus-nginxlog-exporter/blob/master/example-config.hcl
wget https://github.com/martin-helmich/prometheus-nginxlog-exporter/releases/download/v1.0.0/prometheus-nginxlog-exporter
touch prometheus.hcl
添加以下內容
listen {

port = 4040
address = "0.0.0.0"
}
namespace "app1" {

format = "$remote_addr - $remote_user [$time_local] \"$request\" $status $body_bytes_sent \"$http_referer\" \"$http_user_agent\" \"$http_x_forwarded_for\""
source_files = ["/var/log/nginx/e_document_access.log"]
labels {

app = "my-application"
environment = "production"
foo = "bar"
}
}
Nginx exporter需要注意的是format需要與Nginx中的format一致
nginx的配置uwsgi如下
user www-data;
worker_processes auto;
pid /run/nginx.pid;
include /etc/nginx/modules-enabled/*.conf;
events {

worker_connections 768;
# multi_accept on;
}
http {

client_max_body_size 100m;
include mime.types;
default_type application/octet-stream;
log_format main '$remote_addr - $remote_user [$time_local] "$request" '
'$status $body_bytes_sent "$http_referer" '
'"$http_user_agent" "$http_x_forwarded_for"';
sendfile on;
keepalive_timeout 65;
gzip on; #是否開啟gzip模塊 on表示開啟 off表示關閉
gzip_buffers 4 16k; #設置壓縮所需要的緩沖區大小
gzip_comp_level 6; #壓縮級別1-9,數字越大壓縮的越好,也越占用CPU時間
gzip_min_length 100k; #設置允許壓縮的最小字節
gzip_http_version 1.1; #設置壓縮http協議的版本,默認是1.1
gzip_types text/plain text/css application/json application/x-javascript text/xml application/xml application/xml+rss text/javascript; #設置壓縮的文件類型
gzip_vary on; #加上http頭信息Vary: Accept-Encoding給後端代理服務器識別是否啟用 gzip 壓縮
server {

listen 80;
server_name 127.0.0.1;
access_log /var/log/nginx/e_document_access.log main;
location /swagger {

proxy_pass http://127.0.0.1:8000/swagger;
}
location /api {

add_header 'Access-Control-Allow-Origin' '*';
add_header 'Access-Control-Allow-Credentials' 'true';
add_header 'Access-Control-Allow-Methods' 'GET, POST, OPTIONS';
add_header 'Access-Control-Allow-Headers' 'DNT,X-CustomHeader,Keep-Alive,User-Agent,X-Requested-With,If-Modified-Since,Cache-Control,Content-Type';
add_header Content-Security-Policy "default-src 'self'";
proxy_read_timeout 300;
proxy_send_timeout 300;
include uwsgi_params;
uwsgi_pass unix:/home/admin/application/backend/e_document.sock;
}
location /{

root /home/admin/application/dist;
index index.html index.htm;
location ~ .*\.(?:js|css|png|ico|jpg|woff|svg|eot|ttf)$ {

add_header 'Cache-Control' 'max-age=31104000';
}
location ~ .*\.(?:htm|html)$ {

add_header 'Cache-Control' "private, no-store, no-cache, must-revalidate, proxy-revalidate";
}
}
error_page 500 502 503 504 /50x.html;
location = /50x.html {

root html;
}
}
server {

# the port your site will be served on
listen 8000;
# the domain name it will serve for
server_name 127.0.0.1; # substitute your machine's IP address or FQDN
charset utf-8;
# max upload size
client_max_body_size 75M; # adjust to taste
location /static {

alias /home/wgy/code/e_document/static; # your Django project's static files - amend as required
}
# Finally, send all non-media requests to the Django server.
location / {

uwsgi_pass unix:///home/admin/application/backend/e_document.sock;
include /home/admin/application/backend/uwsgi_param; # the uwsgi_params file you installed
}
}
}
啟動 nginx-exporter
./prometheus-nginxlog-exporter -config-file /pfad/zur/config.hcl
To ensure that the exporter starts automatically on system startup, you can configure a systemd unit (starting at Debian 8, Ubuntu 16.04 or CentOS 7). Place this file at
/etc/systemd/system/prometheus-nginxlog-exporter.service:
[Unit]
Description=NGINX metrics exporter for Prometheus
After=network-online.target
[Service]
ExecStart=/usr/local/bin/prometheus-nginxlog-exporter -config-file /etc/prometheus-nginxlog-exporter.hcl
Restart=always
ProtectSystem=full
CapabilityBoundingSet=
[Install]
WantedBy=multi-user.target
Average response time: sum(rate(app_http_response_time_seconds_sum[5m])) by (instance) / sum(rate(app_http_response_time_seconds_count[5m])) by (instance)
Requests per second: sum(rate(app_http_response_time_seconds_count[1m])) by (instance)
Response time (90% quantile): app_http_response_time_seconds{quantile=“0.9”,method=“GET”,status=“200”}
HTTP traffic: sum(rate(app_http_response_size_bytes[5m])) by (instance)
Status codes per second: sum(rate(app_http_response_count_total[1m])) by (status)