Understand the logistic regression model and master the parameter estimation algorithm of the logistic regression model.
To achieve parameter estimation of two loss functions (1. No penalty term; 2. Add penalty to parameters), gradient descent, conjugate gradient or Newton's method can be used.
Authentication:
The essence of our classifier's classification problem is to predict the position label of a known sample, that is, P(Y=1|x < x1, … , xn).According to the method of Naive Bayes, the Bayesian probability formula can be used to convert it into the product of class conditional probability (likelihood) and class probability.This experiment is to directly find the probability.
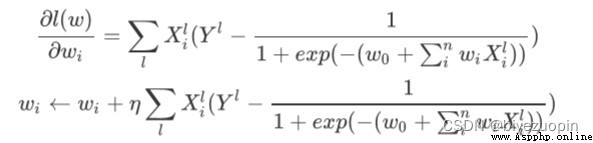
By derivation we can get:
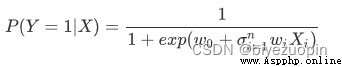
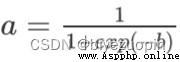
Define the sigmoid function as:
Calculate the loss function as:
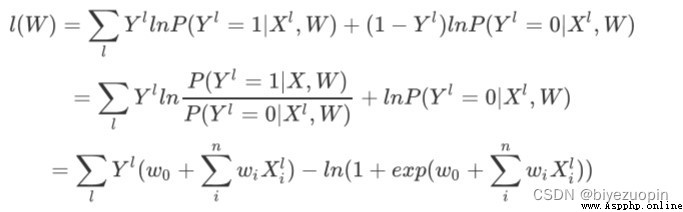
Use the gradient descent method to obtain W = argmaxwl(w). Note that if you want to use gradient descent, generally convert the l(w) here to the opposite number, and use -l(w) as the loss function to find the minimum value..
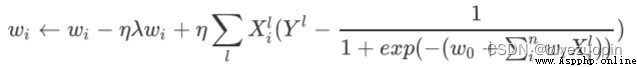
And our gradient descent with the regular term is
The first is to generate data. If you want to generate data whose class conditional distribution satisfies the naive Bayes hypothesis, then use an independent Gaussian distribution for each dimension of each class.If you want to generate data for which the class-conditional distribution does not satisfy the Naive Bayes assumption, then use a two-dimensional Gaussian distribution for both dimensions of each class.It should be noted that due to the characteristics of the Gaussian distribution, the independence of the multi-dimensional Gaussian distribution can be derived from the uncorrelatedness. Therefore, the two-dimensional Gaussian distribution can be used to generate data. If the naive Bayesian assumption is satisfied, then the non-pair of the covariance matrixThe diagonal elements are all 0. If the Naive Bayes assumption is not satisfied, then the off-diagonal elements of the covariance matrix are not 0 (the covariance matrix should be a symmetric matrix).
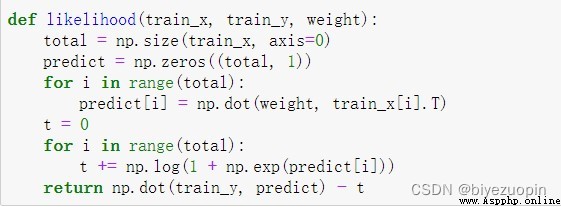
Calculate maximum likelihood estimates:
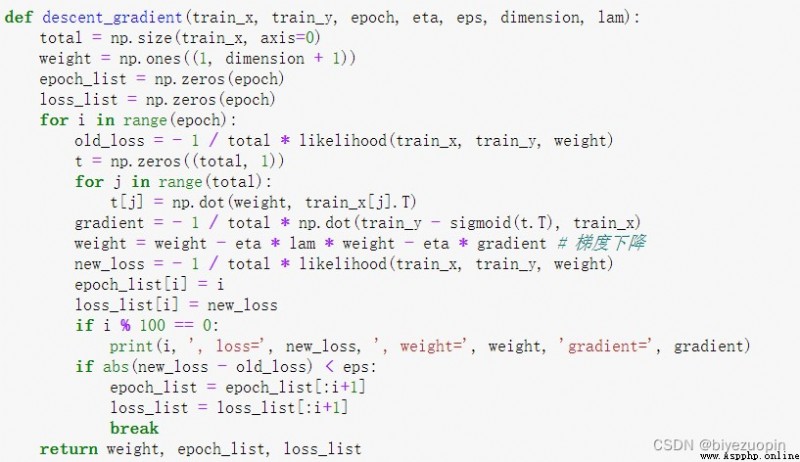
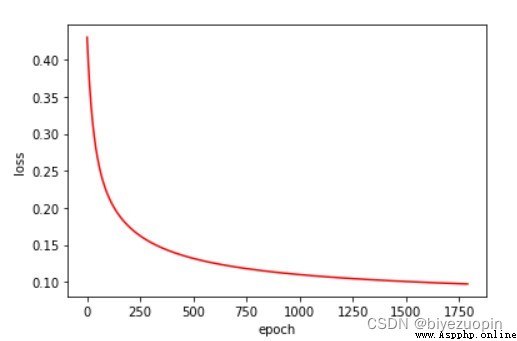
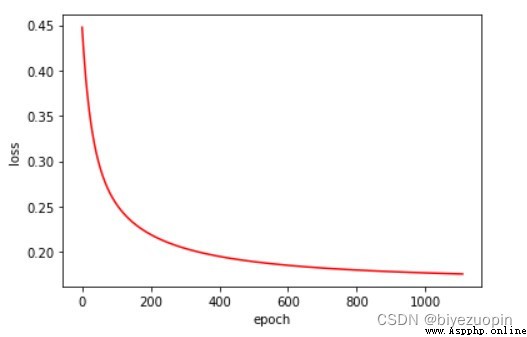
Gradient descent algorithm:
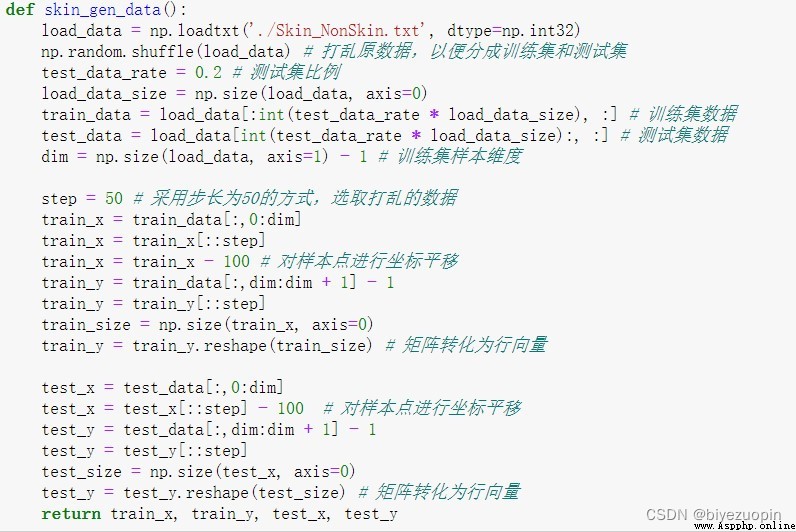
When doing the data on the UCI, the skin Skin_NonSkin.txt data is selected.Due to the large amount of data, only a part of it is selected here.
When reading data, use numpy slices to extract data information, use 50 as the step size, and extract some data for experimentation.It is also necessary to perform spatial translation on the sample points, otherwise it may overflow when calculating MCLE, because when calculating MCLE, it is necessary to do matrix multiplication with parameters and samples, and it is also used as an exponent calculation, which may overflow.
Generate the data yourself
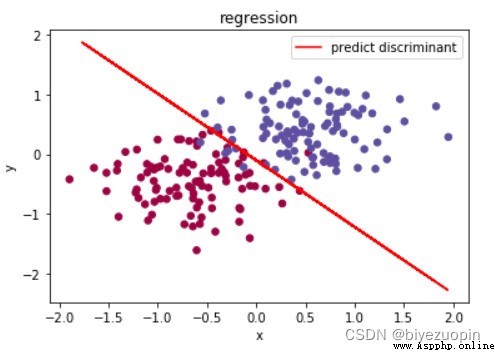
Class conditional probability satisfies Naive Bayes hypothesis, regular term λ=0, size=200
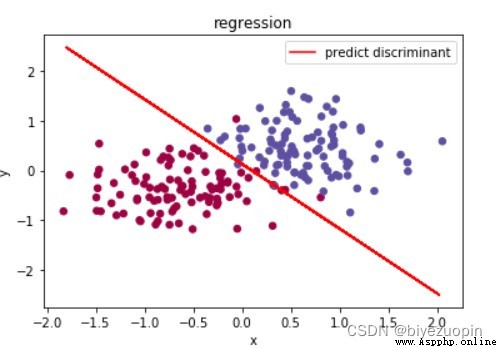
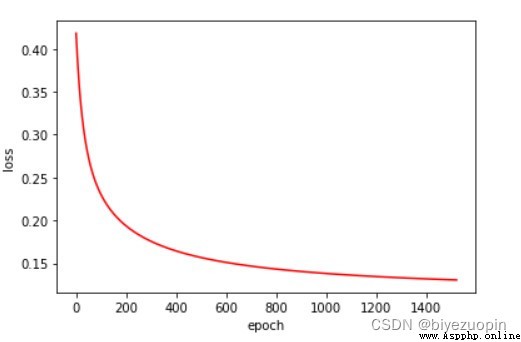
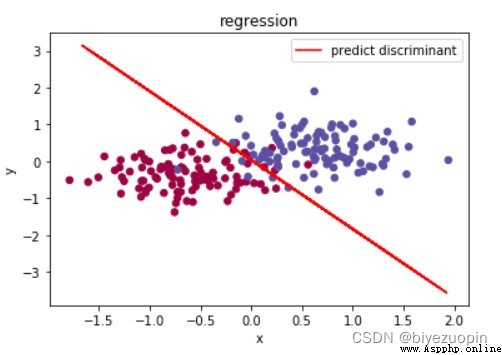
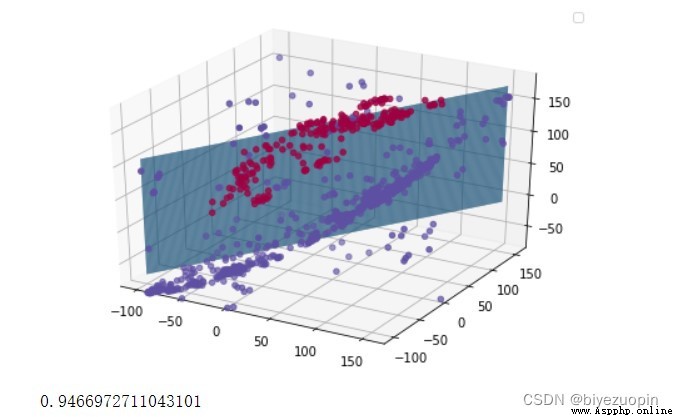
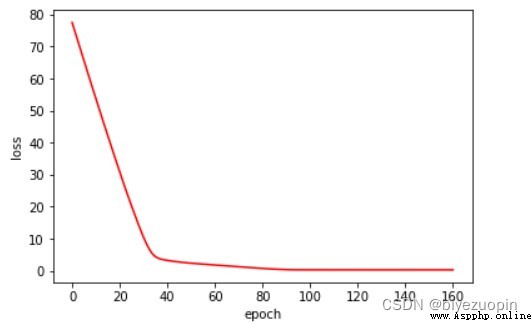
Class conditional probability does not satisfy Naive Bayes hypothesis, regular term λ=0, size=200
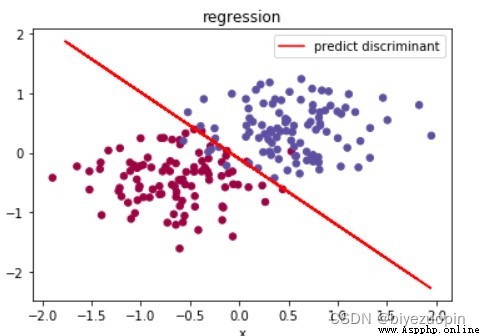
The class conditional distribution satisfies the Naive Bayes hypothesis, the regular term λ=0.001, size=200
Class conditional probability does not satisfy Naive Bayes hypothesis, regular term λ=0.001, size=200
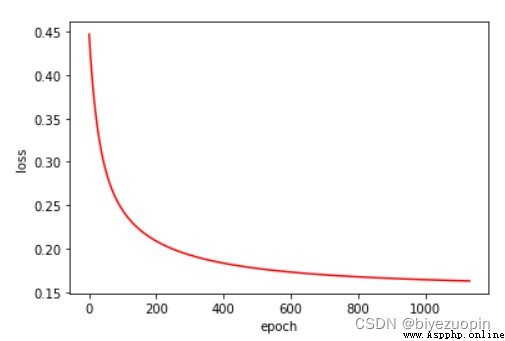
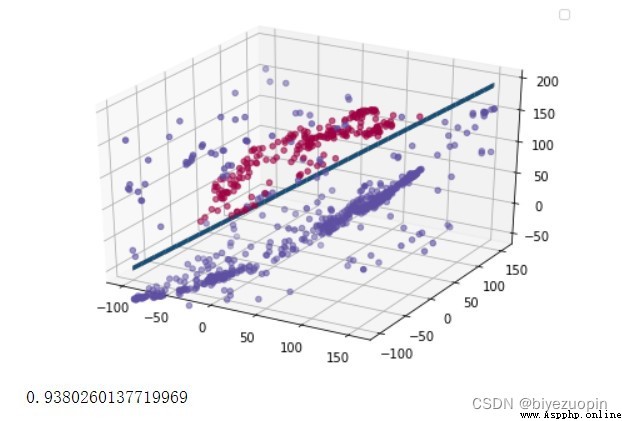
UCI Skin Color Dataset
Regular term λ=0
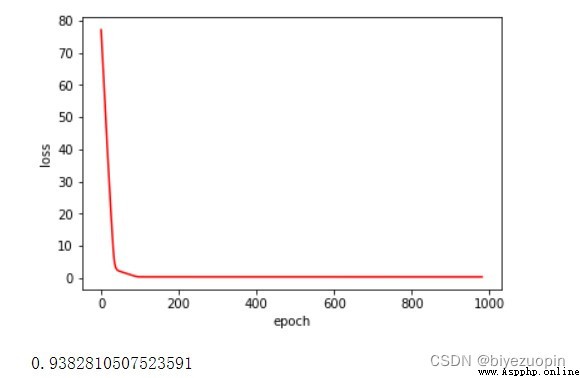
Regular term λ=0.01
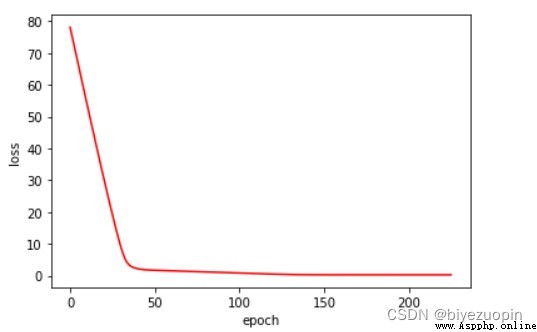
UCI banknote dataset
Regular term λ=0
Regular term λ=0.01
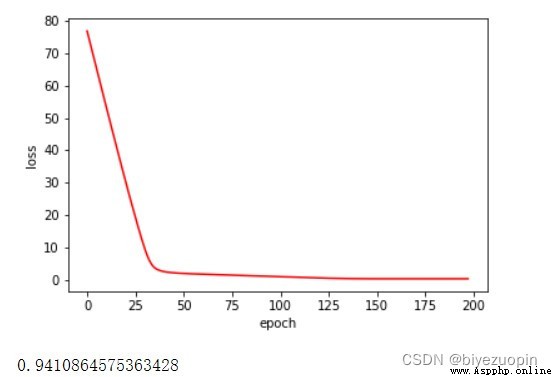
The experiment found that the accuracy of the 20% test set of UCI's data is basically stable at 93%-94%.When the amount of data is large, the regular term has little effect on the results, and when the amount of data is small, it should be able to effectively solve the problem of overfitting.The class-conditional distribution performs slightly better when the Naive Bayes assumption is satisfied than when the assumption is not satisfied.Logistic regression can solve simple linear classification problems well, and the convergence speed is fast.
When the amount of data is large, it has little effect on the results. When the amount of data is small, it should be able to effectively solve the problem of overfitting.The class-conditional distribution performs slightly better when the Naive Bayes assumption is satisfied than when the assumption is not satisfied.Logistic regression can solve simple linear classification problems well, and the convergence speed is fast.