Implement a k-means algorithm and a Gaussian mixture model, and use the EM algorithm to estimate the parameters in the model.
k-means clustering algorithm (k-means clustering algorithm) is an iterative clustering analysis algorithm. The steps are: pre-divide the data into K groups, then randomly select K objects as the initial clustering centers, and then calculate the distance between each object and each seed cluster center, and assign each object to the cluster center closest to it.Cluster centers and the objects assigned to them represent a cluster.Each time a sample is assigned, the cluster center of the cluster is recalculated based on the existing objects in the cluster.This process will repeat until a certain termination condition is met.Termination conditions can be that no (or a minimum number) of objects are reassigned to different clusters, no (or a minimum number) of cluster centers change again, and the sum of squared errors is locally minimized.
The algorithm is: first randomly select K objects as the initial cluster centers.Then calculate the distance between each object and each seed cluster center, and assign each object to the cluster center closest to it.Cluster centers and the objects assigned to them represent a cluster.Once all objects have been assigned, the cluster center for each cluster is recalculated based on the existing objects in the cluster.This process will repeat until a certain termination condition is met.The termination condition can be any of the following:
GMM, Gaussian Mixture Model, can also be abbreviated as MOG.The Gaussian model is to use the Gaussian probability density function (normal distribution curve) to accurately quantify things, and decompose a thing into several models based on the Gaussian probability density function (normal distribution curve).
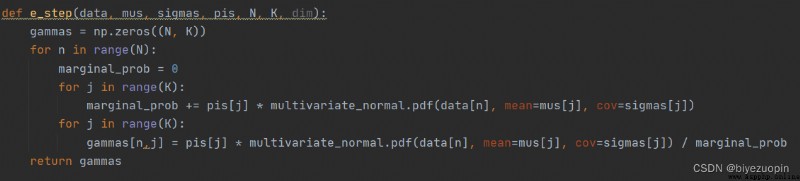
Compared with K-means, GMM is an application implementation of a more complex EM algorithm.Different from K-means, the GMM algorithm does not use the "closest distance method" to assign a class (hard assignment) to each sample at step E, but increases the latent variable γ.γ is a matrix of (N,K), γ[N,K] represents the probability that the nth sample is the kth class, so it has normalization.That is, the sum of the elements of each row of is 1.
The GMM algorithm uses a Gaussian mixture model to describe the distribution of samples, because in a multi-class situation, a single Gaussian distribution must not be able to describe the data distribution.A simple superposition of multiple Gaussian distributions also fails to describe the data distribution.Only a mixture of Gaussian distributions can better describe a set of samples generated by multiple Gaussian models.For any data point in the sample, the probability that any Gaussian model can generate the point, that is, the contribution of any Gaussian model to the generation of the point is different, but it is certain that the sum of these contributionsThe value is 1.
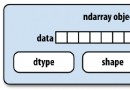
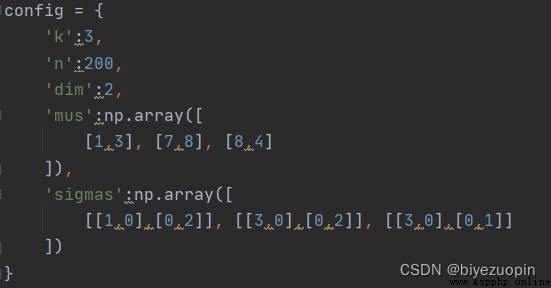
Gaussian distribution parameters:
Step E:
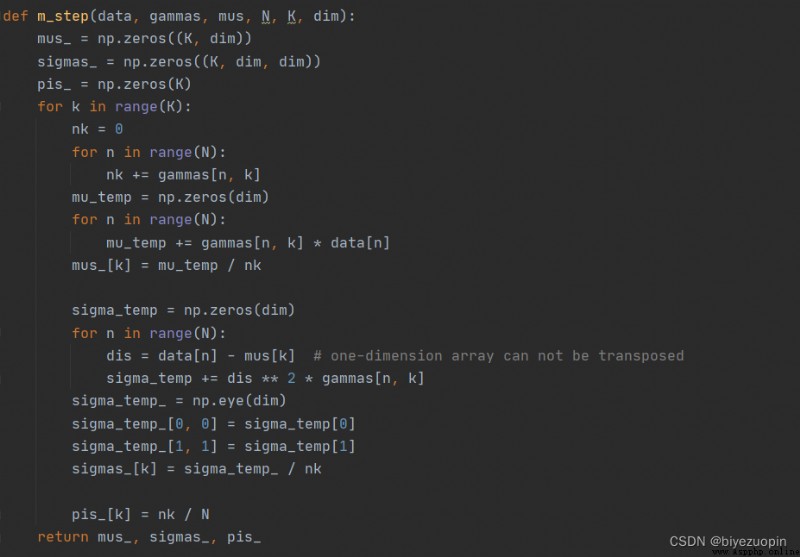
Step M:
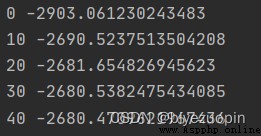
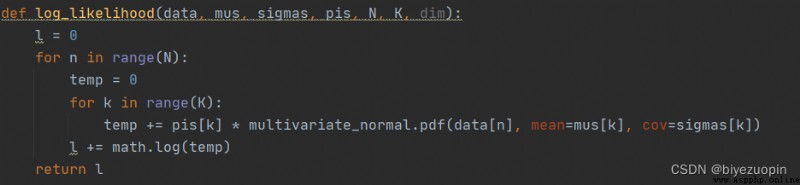
Maximum Likelihood Estimation:
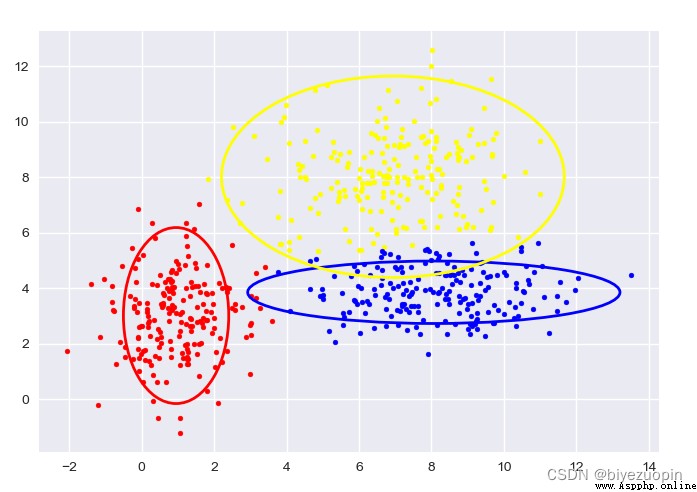
Self-generated data, K-means:
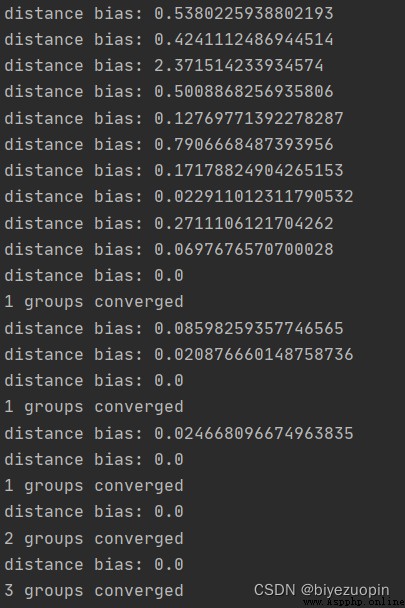
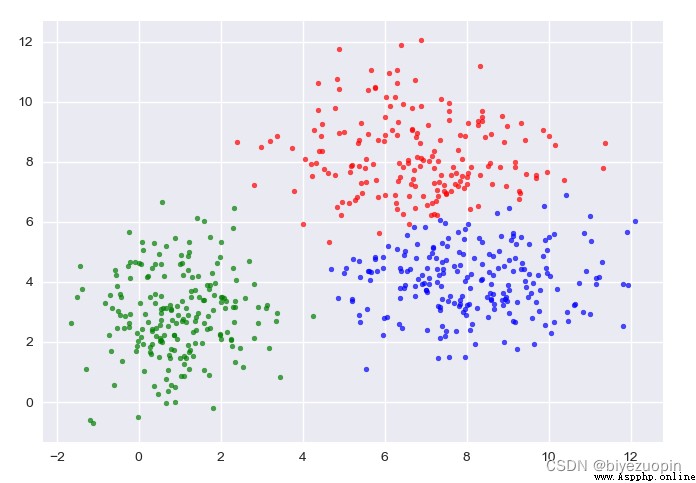
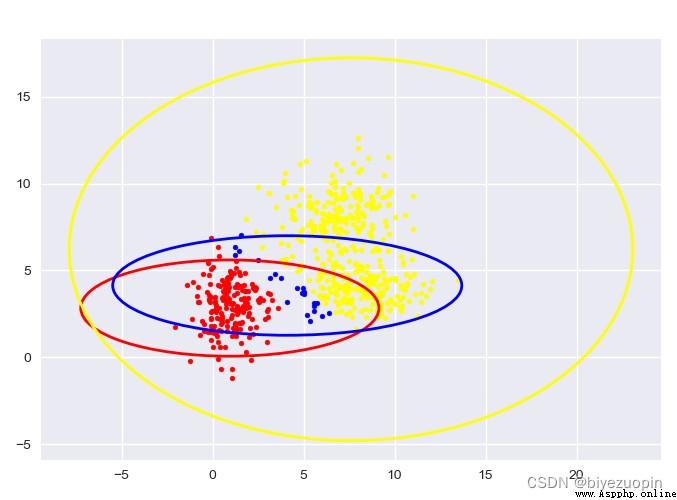
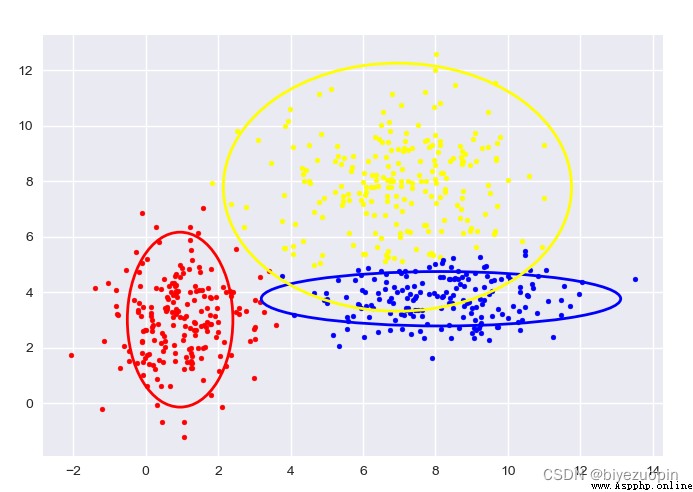
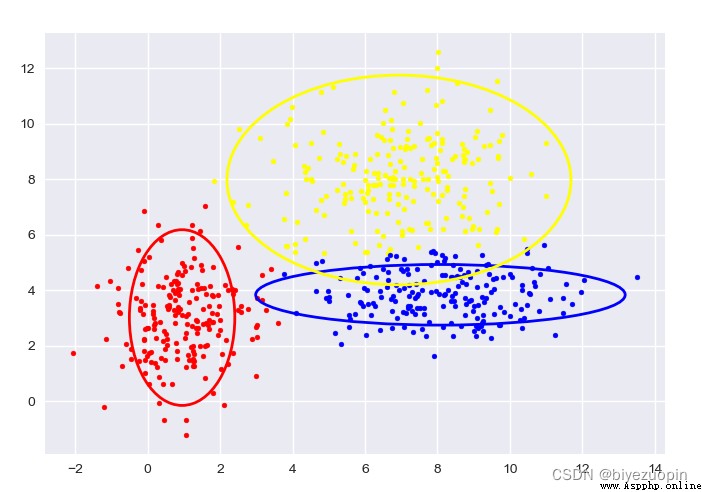
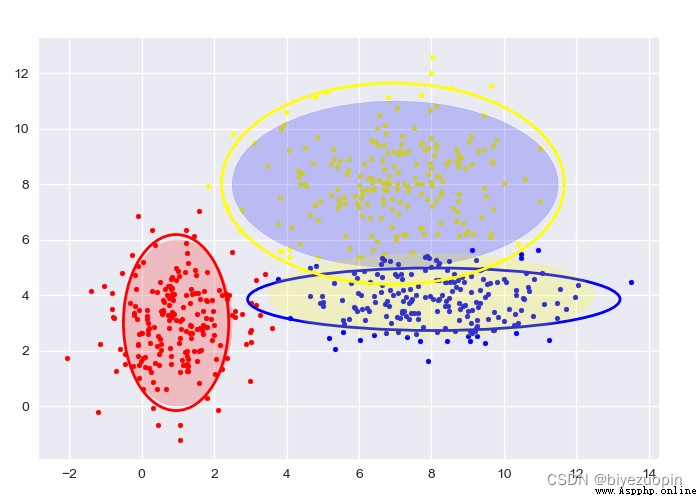
Self-generated data, GMM:
The figure shows the sample classification and confidence ellipse of each stage.
The transparent confidence ellipse with padding at the end is the real ellipse of the generated data.