Table of Contents
First, actual combatScene
Second, the main knowledge points
File read and write
Basic Grammar
String Handlingp>
File Generation
Data Construction
Three.
1. Create pythonDocument
2. Running results
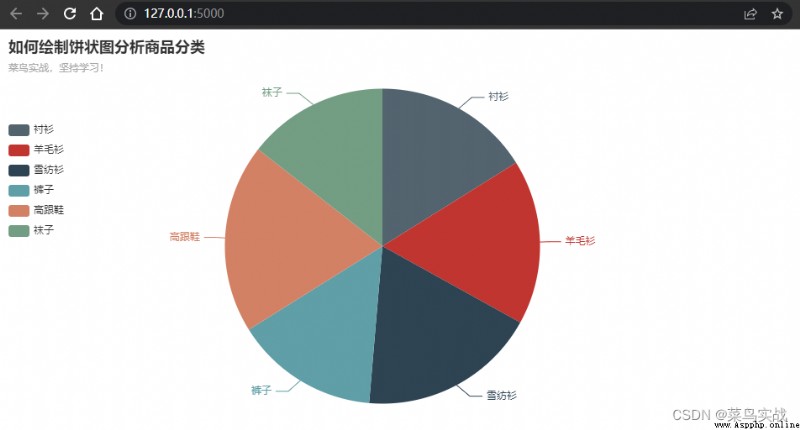
Actual combat scenario: how to draw a pie chart to analyze product inventory
File read and write
Basic syntax
String Handling
File Generation
Data Construction
Schedule now!
"""Author:Practical scenario: how to draw a pie chart to analyze commodity inventory"""# import system packagesimport platformfrom flask import Flask, render_templatefrom pyecharts import options as optsfrom pyecharts.charts import *from pyecharts.faker import Fakerprint("Hello,")print("Practical scenario: how to draw a pie chart to analyze product classification")web = Flask(__name__)# data buildx_data = ["shirt", "cardigan", "chiffon shirt", "pants", "high heels", "socks"]y_data = [1186, 1246, 1346, 1086, 1430, 1064]data = [[x_data[i], y_data[i]] for i in range(len(x_data))]def pie_charts() -> Pie():# instantiate the objectpie = Pie()# Use the Flask library to get the color directlypie.add("", data, color=Faker.rand_color())# Globally set title, labelpie.set_global_opts(title_opts=opts.TitleOpts(title="How to draw a pie chart to analyze product classification", subtitle=", keep learning!"),legend_opts=opts.LegendOpts(type_="scroll", orient="vertical", pos_top="20%", pos_left="0%"))return pie# get objectp = pie_charts()# Draw graphics and generate HTML filesp.render('./templates/pie_charts.html')# Add route display [email protected]('/')def index():return render_template('pie_charts.html')if __name__ == "__main__":# run the projectweb.run(debug=False)print("Python version", platform.python_version())Hello,
Practical scenario: how to draw a pie chart to analyze product classification* Serving Flask app 'py032' (lazy loading)
* Environment: production
WARNING: This is a development server. Do not use it in a production deployment.
Use a production WSGI server instead.
* Debug mode: off
* Running on http://127.0.0.1:5000 (Press CTRL+C to quit)
Keep learning!
Let me introduce myself first. The editor graduated from Jiaotong University in 2013. I worked in a small company and went to big factories such as Huawei and OPPO. I joined Ali in 2018, until now.I know that most junior and intermediate java engineers want to upgrade their skills, they often need to explore their own growth or sign up to study, but for training institutions, the tuition fee is nearly 10,000 yuan, which is really stressful.Self-learning that is not systematic is very inefficient and lengthy, and it is easy to hit the ceiling and the technology stops.Therefore, I collected a "full set of learning materials for java development" for everyone. The original intention is very simple. I hope to help friends who want to learn by themselves but don't know where to start, and at the same time reduce everyone's burden.Add the business card below to get a full set of learning materials