Count the total number of dates according to the time of the week, draw matplotlib graphs, pandas, Python
Each date has a corresponding day of the week date. Now suppose there are many random dates, and then get the number of the day of the week corresponding to the date one by one, and then count the number of occurrences of the day of the week for all dates, and finally classify them into Monday toSunday 7 categories, draw statistical charts:
import datetimeimport pandas as pdimport matplotlibimport matplotlib.pyplot as pltfrom random import randrangefrom datetime import timedelta# Generate random number of test timesfrom pprint import pprintSAMPLE_COUNT = 500SECTION = 'section'SUM = 'sum'# Generate a random date between the start and end datesdef random_date(start, end):delta = end - startseconds_delta = (delta.days * 24 * 60 * 60) # seconds between start date and end daterandom_seconds = randrange(seconds_delta)return start + timedelta(seconds=random_seconds)def my_time():times = []for i in range(7):times.append({SECTION: i, SUM: 0})# pprint(times)start_date = datetime.datetime(2000, 1, 1)end_date = datetime.datetime(2021, 12, 31)cnt = 0while cnt < SAMPLE_COUNT:random_d = random_date(start_date, end_date)weekday = random_d.weekday() # 0 is Monday, 6 is Sunday# pprint(f'{random_d.strftime("%Y-%m-%d")} {number_to_weekday(weekday)}')for tx in times:if tx[SECTION] == weekday:tx[SUM] = tx[SUM] + 1breakcnt = cnt + 1return timesdef drawchart(df):myfont = matplotlib.font_manager.FontProperties(fname='C:\Windows\Fonts\msyh.ttc')plt.rcParams['axes.unicode_minus'] = False # Used to display the negative sign normallyplt.rc('font', family='YaHei', weight='bold')order = []name = []mem = []for d, i in zip(df.values, df.index):order.append(i)name.append(d[0])mem.append(int(d[1]))FONT_SIZE = 12fig, ax = plt.subplots(figsize=(15, 13))b = ax.barh(y=range(len(name)), width=mem, align='center', color='red')# Add data labels to the right side of the horizontal column chart.i = 0for rect in b:w = rect.get_width()ax.text(x=w, y=rect.get_y() + rect.get_height() / 2, s='%d' % (int(w)),horizontalalignment='left', verticalalignment='center',fontproperties=myfont, fontsize=FONT_SIZE - 2, color='green')ax.text(x=w / 2, y=rect.get_y() + rect.get_height() / 2, s=str(order[i]),horizontalalignment='center', verticalalignment='center',fontproperties=myfont, fontsize=FONT_SIZE - 3, color='white')i = i + 1ax.set_yticks(range(len(name)))ax.set_yticklabels(name, fontsize=FONT_SIZE - 1, fontproperties=myfont)ax.invert_yaxis()ax.set_xlabel('data', fontsize=FONT_SIZE + 2, fontproperties=myfont)ax.set_title('Statistical ranking of the total number of data points on different Sundays', fontsize=FONT_SIZE + 2, fontproperties=myfont)# Do not label labels on the abscissa.plt.xticks(())# clear the borders aroundax.get_yaxis().set_visible(True)for spine in ["left", "top", "right", "bottom"]:ax.spines[spine].set_visible(False)plt.subplots_adjust(left=0.15) # Adjust the left margin# ax.margins(y=0.01) #zoom zoom inax.set_aspect('auto')plt.show()# Convert numbers 0, 1, 2, 3, 4, 5, 6 to weeks*# 0 is Monday, 6 is Sunday, and so ondef number_to_weekday(number):zh = ['one', 'two', 'three', 'four', 'five', 'six', 'day']weekday = f'week{zh[number]}'return weekdaydef data_to_char():times = my_time()# pprint(times)# Assemble the data into a pandas dataframe.pd_data = []for t in times:l = [number_to_weekday(t[SECTION]), t[SUM]]pd_data.append(l)col = ['week*', 'number of times']df = pd.DataFrame(data=pd_data, columns=col)df = df.sort_values(by=col[1], axis=0, ascending=False) # descending order# reset indexdf = df.reset_index(drop=True)df.index = df.index + 1pprint(df.head(7))drawchart(df)if __name__ == '__main__':data_to_char()Output:
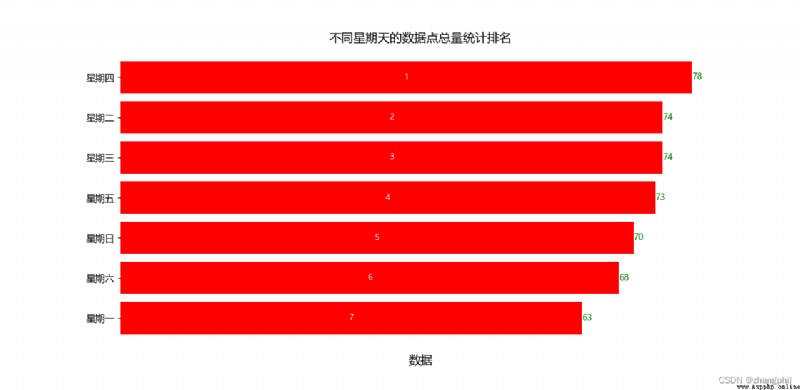
week* times1 Thursday 782 Tuesday 743 Wednesday 744 Friday 735 Sunday 706 Saturday 687 Monday 63Statistical chart: