matploglib 能夠繪制出精美的圖表, 有些時候, 我們希望把一組圖放在一起進行比較, 有沒有什麼好的方法呢?
matplotlib 中提供的 subplot 可以很好的解決這個問題
matplotlib下, 一個 Figure 對象可以包含多個子圖(Axes), 可以使用 subplot() 快速繪制, 其調用形式如下 :
subplot(numRows, numCols, plotNum)
圖表的整個繪圖區域被分成 numRows 行和 numCols 列
然後按照從左到右,從上到下的順序對每個子區域進行編號,左上的子區域的編號為1
plotNum 參數指定創建的 Axes 對象所在的區域
如果 numRows = 2, numCols = 3, Then the whole drawing chart style is 2X3 的圖片區域, 用坐標表示為
(1, 1), (1, 2), (1, 3)
(2, 1), (2, 2), (2, 3)
這時, 當 plotNum = 3 時, 表示的坐標為(1, 3), That is, the subgraph of the first row and the third column
如果 numRows, numCols 和 plotNum 這三個數都小於 10 的話, 可以把它們縮寫為一個整數, 例如 subplot(323) 和 subplot(3,2,3) 是相同的.
subplot在 plotNum 指定的區域中創建一個軸對象. 如果新創建的軸和之前創建的軸重疊的話,之前的軸將被刪除.
#!/usr/bin/env python
#!encoding=utf-8
import matplotlib
import matplotlib.pyplot as plt
if __name__ == '__main__':
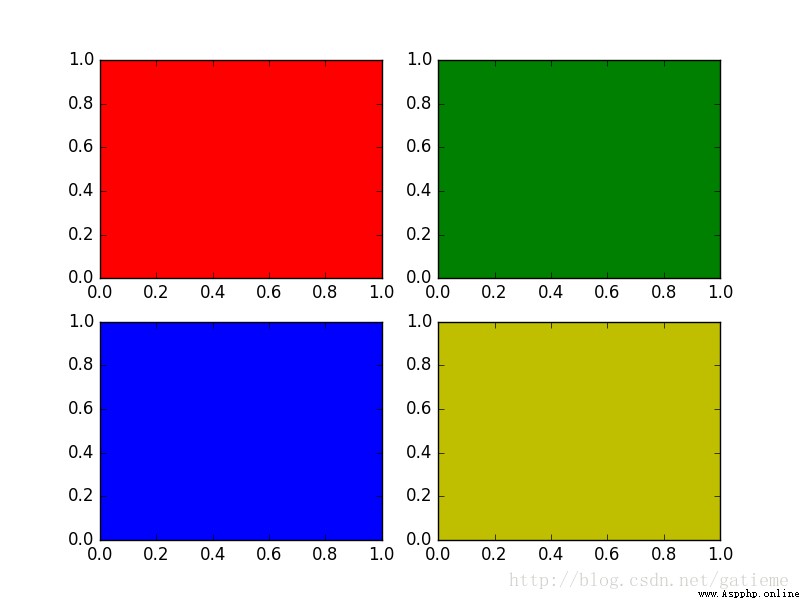
for i,color in enumerate("rgby"):
plt.subplot(221+i, axisbg=color)
plt.show()
But sometimes our divisions are not regular, 比如如下的形式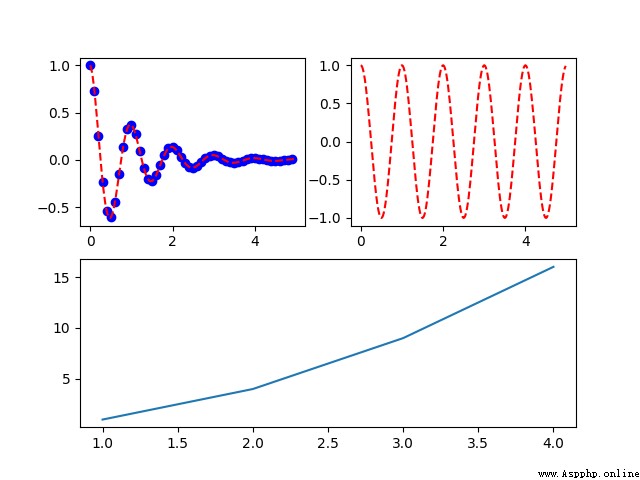
How should this be divided??
the entire table according to 2*2 劃分
前兩個簡單, 分別是 (2, 2, 1) 和 (2, 2, 2)
但是第三個圖呢, 他占用了 (2, 2, 3) 和 (2, 2, 4)
show that it needs to be re-divided, 按照 2 * 1 劃分
前兩個圖占用了 (2, 1, 1) 的位置
因此第三個圖占用了 (2, 1, 2) 的位置
————————————————

#!/usr/bin/env python
#!encoding=utf-8
import matplotlib.pyplot as plt
import numpy as np
def f(t):
return np.exp(-t) * np.cos(2 * np.pi * t)
if __name__ == '__main__' :
t1 = np.arange(0, 5, 0.1)
t2 = np.arange(0, 5, 0.02)
plt.figure(12)
plt.subplot(221)
plt.plot(t1, f(t1), 'bo', t2, f(t2), 'r--')
plt.subplot(222)
plt.plot(t2, np.cos(2 * np.pi * t2), 'r--')
plt.subplot(212)
plt.plot([1, 2, 3, 4], [1, 4, 9, 16])
plt.show()