This paper introduces some Python Advanced debugging skills .
If you're still as brainless as a novice print debugging ,
Then learn from Daniel how to debug gracefully Python Code it .
As an experienced developer ,
Even if you write clear, readable code
And has carried on the omni-directional test to the code ,
But in some cases, the program will inevitably appear some strange Bug,
At this point you need to be in some way Debug.
Many programmers like to use a bunch of print Statement to see how the code is running .
It's a little low-level , What a fool ;
There are actually many better ways to help you locate problems in your code ,
We will introduce these methods in this article .python Learning exchange group :903971231###

Use Logging modular
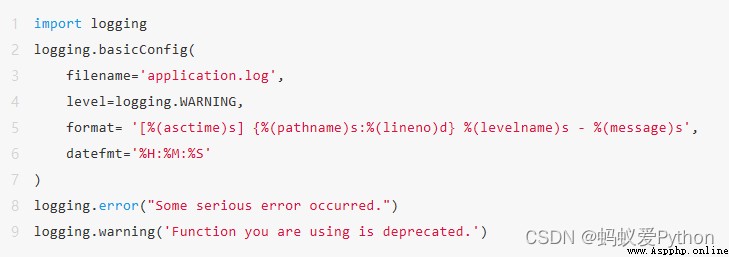
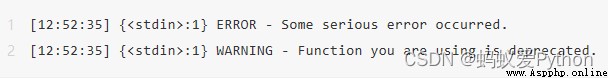
If you write an application that doesn't use logging , Then you will regret not using it in time . If there is no run log printed in the application , It is very difficult to locate and remove the program error . Fortunately in Python in , It's easy to configure the basic logging module :
This is all that is needed to start writing the log to a file , When using , You can go through
logging.getLoggerClass().root.handlers[0].baseFilename Find the path to the file :
This setting seems to be good enough ( This is usually the case ),
But the configuration is reasonable 、 The format is clear 、 A readable log can let you Debug It's easier to get up .
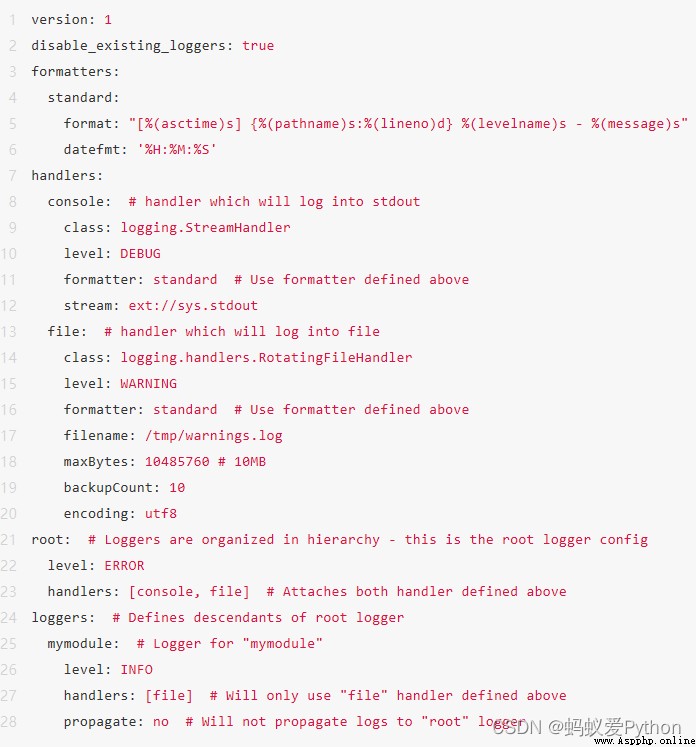
One way to optimize log configuration is to use .ini or .yaml The configuration file .
Here is a configuration example for you :
stay python Using this generic configuration in the code will be difficult to edit and maintain .
Save the configuration content in YAML In file ,
By loading the configuration file ,
We can avoid these problems ,
You can also easily modify the log configuration later .
If you want to know what all these configuration fields mean ,
You can view this document , Most of them are just keyword parameters ,
As the example above shows .python Learning exchange group :903971231###
We have defined the relevant configuration of the log component in the configuration file ,
Next we need to load the configuration in some way .
If you are using YAML The configuration file ,
The simplest way to load the configuration is as follows :
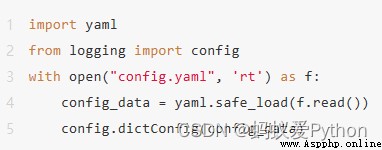
Python logger Actually, it doesn't directly support YAML file ,
But it supports dictionary configuration ,
have access to yaml.safe_load from YAML File easy to create dictionary configuration .
If you tend to use .ini file , So I just want to point out , For new applications ,
Many documents recommend dictionary configuration .
For more examples , You can check the user manual .
The log decorator uses
Continue with the log module techniques mentioned above .
You may come across a situation where ,
Just want to debug Function call execution .
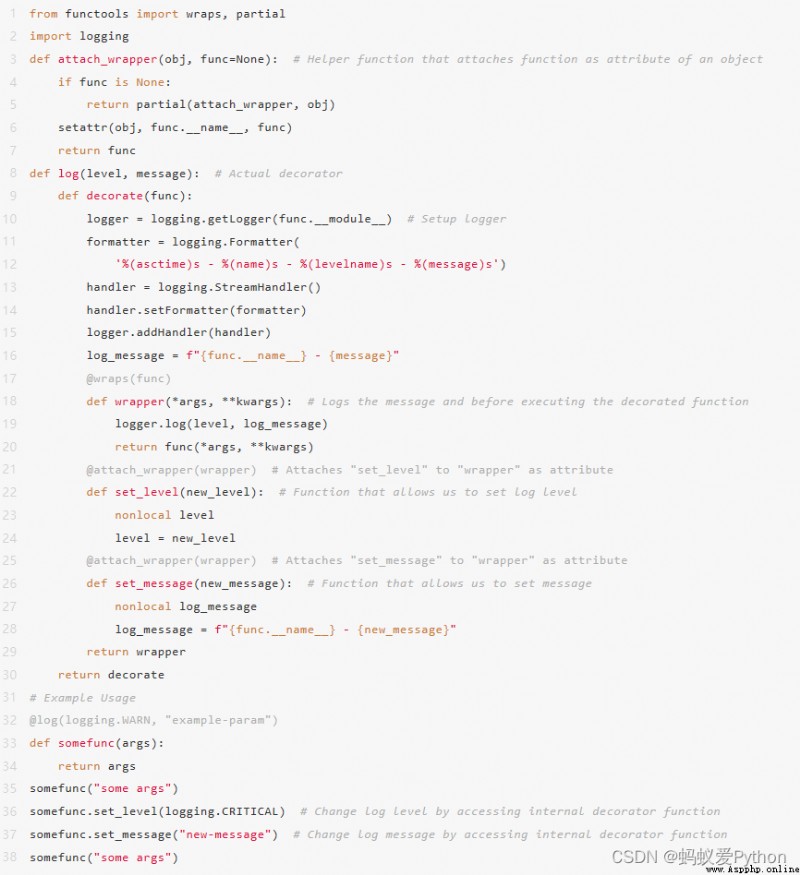
You can use the log decorator ,
It can be realized without modifying the function body code :
Tell the truth ,
This may take some time to decorate the called function ( actually , All you need to do is copy and paste ).
Its cleverness is through log Function to set parameters ,
And use the parameters for the internal wrapper function .
then , Make these parameters adjustable by adding accessor functions attached to the decorator .
as for functools.wraps Decorator ,
If we don't use it here ,python Learning exchange group :903971231###
The name of the decorated function (func .name) Will be covered by the name of the decorator .
Here we need functools.wraps Decorator ,
Because we debug Use the real name of the function .
Its principle is to copy the original function name 、 Function document description and parameter list to decorator function .
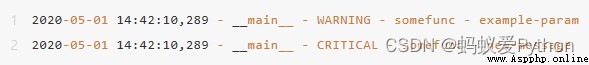
Here is the output of the above code . It looks neat ?
overridden repr
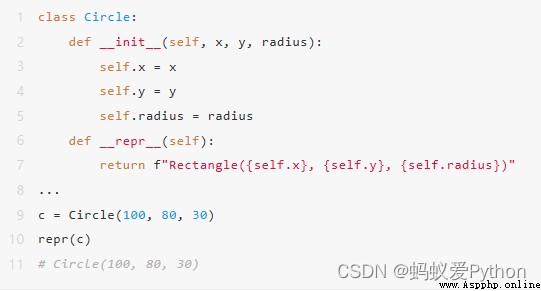
You can add repr Method to improve the code , Make it easier to debug .
Its function is to return the string representation of class instances .
repr The best practice of the method is to output text that can be used to recreate the instance .
for example :
If you don't want or can't represent objects like above ,
Another good way is to use <…> Express ,
for example <_io.TextIOWrapper name=‘somefile.txt’ mode=‘w’ encoding=‘UTF-8’>.python Learning exchange group :903971231###
except repr outside , rewrite str Method is also a good way ,
This method is in use print(instance) Is called by default .
Use these two methods , You just print variables to get a lot of information .
Rewrite dictionary class missing Method
If for some reason you need to implement a custom dictionary class , So when you try to access a key that doesn't actually exist , Maybe because of KeyErrors Cause some mistakes . In order to avoid debug There's no thread in the code , Can achieve missing This particular method , This method triggers KeyError Will be called .
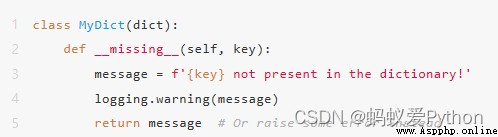
The above implementation is very simple , Only return and record the missing key message , But you can also record other valuable information , In order to provide you with more context reference in case of code problems .
Debugging a crashed application
If the application crashes, you have a chance to see what happens , Then you may find this technique very useful .
You need to use -i Parameters (python3 -i app.py) Running the application , This parameter causes the program to start immediately after exiting and enter interactive shell. here , You can check variables and functions in the current environment .
If that's not good enough , So you can use something more powerful pdb, namely Python Debugger.pdb It has many functions , These functions can be introduced in a long article . Here is an example , I just picked out the most important part . First, let's take a look at the crash script :python Learning exchange group :903971231###

Now? , If we use -i Parameter to run it , We will have the opportunity to debug it :
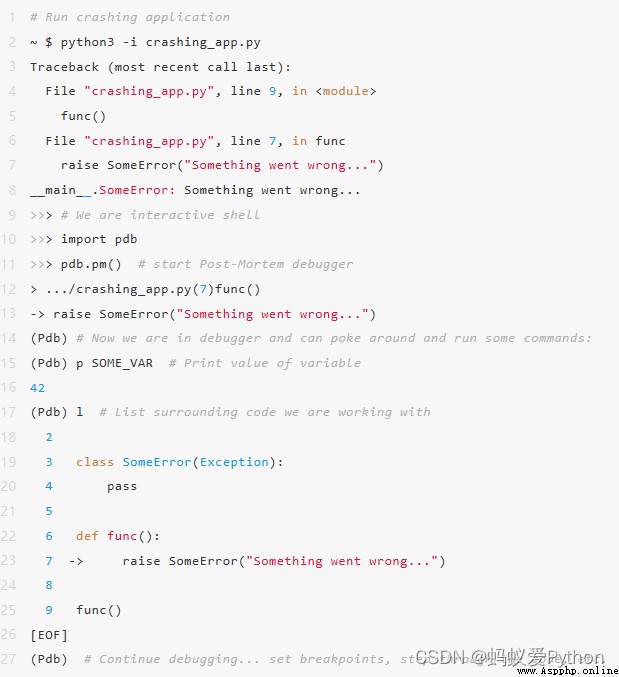
The debugging session above shows very clearly that you can use pdb Operations performed .
After the program is terminated , We enter an interactive debugging session .
First , We import pdb And start the debugger .
At this point we can use all the pdb command .
In the example above , We use p Command to print variables , And use l The command lists the code .
Most of the time , You may want to set breakpoints ,
have access to b LINE_NO To set breakpoints ,
Then run the program until the breakpoint (c) Be suspended ,
And then continue to use s Step by step the function ,
You can also choose to use w Print stack information .
A complete list of commands , You can refer to pdb Using document .
Check stack information
Suppose your code is running on a remote server Flask or Django Applications ,
You can't get interactive debugging sessions .
under these circumstances ,
You can use traceback and sys software package
To learn more about the exceptions that occur in the code :
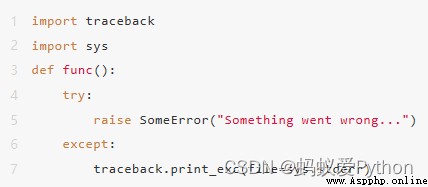
After operation , The above code will print the last exception thrown .
In addition to printing exception information ,
You can also use traceback Package print stack information (traceback.print_stack()) Or extract the original stack frame ,
Format it and check it further (traceback.format_list(traceback.extract_stack())).
Reload module during debugging
Sometimes you may be debugging or interacting Shell Some method functions are tested in ,
And make some changes to it .
In order to simplify the operation of the code / Testing and modification process ,
Can run importlib.reload(module) To avoid having to restart the interactive session after each change :
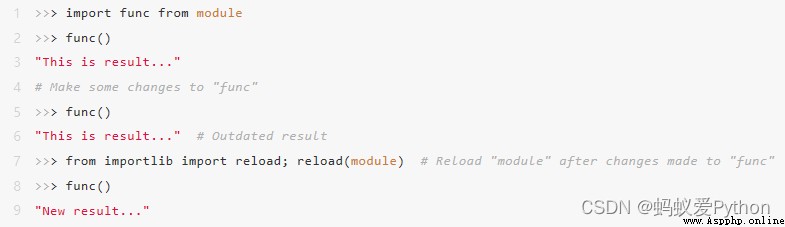
This technique is more about efficiency .
It can help you skip unnecessary steps , Make your work faster 、 More efficient .
The ability to reload modules in real time often works well ,
You've been able to debug code a lot because it helps ,
Save precious time .