Python Machine learning cases : Van Gogh's 《 Starry sky 》 Picture compression
In this case, singular value decomposition is used to process image compression tasks . The picture to be compressed is shown in the figure , It's van Gogh's work 《 Starry sky 》.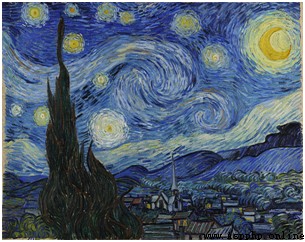
Python The implementation code is as follows :
 from PIL import Image
import os
from numpy import *
import matplotlib as mpl
import matplotlib.pyplot as plt
if __name__ == '__main__':
mpl.rcParams['font.sans-serif'] = [u'simHei']
mpl.rcParams['axes.unicode_minus'] = False
A = Image.open('starry_night.jpg')
a = array(A) # Convert to matrix
# Because it's a color image , therefore 3 passageway .a The innermost array of is three numbers , respectively RGB, Used to represent a pixel
u_r, sigma_r, v_r = linalg.svd(a[:, :, 0])
u_g, sigma_g, v_g = linalg.svd(a[:, :, 1])
u_b, sigma_b, v_b = linalg.svd(a[:, :, 2])
def restore1(u, sigma, v, k):
m = len(u)
n = len(v)
a = zeros((m, n))
# Reconstruct the image
a = dot(u[:, :k], diag(sigma[:k])).dot(v[:k, :])
# The above statement is equivalent to the following form
#for i in range(k):
# ui = u[:, i].reshape(m, 1)
# vi = v[i].reshape(1, n)
# a += sigma[i] * dot(ui, vi)
a[a < 0] = 0
a[a > 255] = 255
return rint(a).astype('uint8')
plt.figure(facecolor = 'w', figsize = (10, 10))
# The number of singular values retained is :1,2,...,12
K = 12
for k in range(1, K + 1):
print(k)
R = restore1(u_r, sigma_r, v_r, k)
G = restore1(u_g, sigma_g, v_g, k)
B = restore1(u_b, sigma_b, v_b, k)
I = stack((R, G, B), axis = 2)
# Picture after reality reconstruction
plt.subplot(3, 4, k)
plt.imshow(I)
plt.axis('off')
plt.title(u' Number of singular values :%d' % k)
plt.suptitle(u'SVD And image decomposition ', fontsize = 20)
plt.tight_layout(0.1, rect = (0, 0, 1, 0.92))
plt.show()
The output result of running the above code is shown in the figure .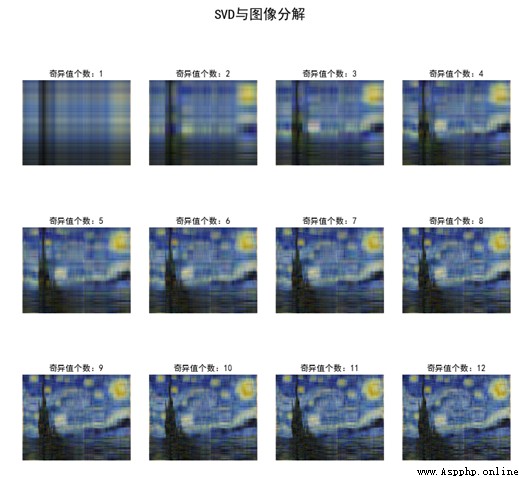
Here, this simple strength is completed !