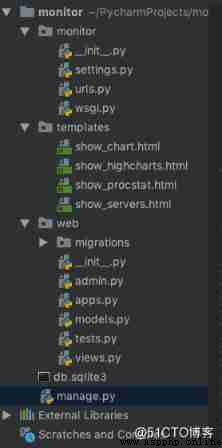
1.mysql database
# Author: Allan

# Datetime: 2019-05-21

import pymysql

pymysql.install_as_MySQLdb()


DATABASES = {

 'default': {

 # notes sqlite3

 # 'ENGINE': 'django.db.backends.sqlite3',

 # 'NAME': os.path.join(BASE_DIR, 'db.sqlite3'),


 # mysql

 'ENGINE': 'django.db.backends.mysql',

 'NAME': 'database',

 'USER': 'username',

 'PASSWORD': 'password',

 'HOST': 'ip',

 'PORT': 3306,

 }

}
2.Application definition
INSTALLED_APPS = [

 'django.contrib.admin',

 'django.contrib.auth',

 'django.contrib.contenttypes',

 'django.contrib.sessions',

 'django.contrib.messages',

 'django.contrib.staticfiles',

 'web' # add to App, below python3 mkmigrations web Use

]


MIDDLEWARE = [

 'django.middleware.security.SecurityMiddleware',

 'django.contrib.sessions.middleware.SessionMiddleware',

 'django.middleware.common.CommonMiddleware',

 # 'django.middleware.csrf.CsrfViewMiddleware', Comment on this line , prevent 403 error

 'django.contrib.auth.middleware.AuthenticationMiddleware',

 'django.contrib.messages.middleware.MessageMiddleware',

 'django.middleware.clickjacking.XFrameOptionsMiddleware',

]


ROOT_URLCONF = 'monitor.urls'


TEMPLATES = [

 {

 'BACKEND': 'django.template.backends.django.DjangoTemplates',

 'DIRS': [os.path.join(BASE_DIR, 'templates')], # Modify the template directory

 'APP_DIRS': True,

 'OPTIONS': {

 'context_processors': [

 'django.template.context_processors.debug',

 'django.template.context_processors.request',

 'django.contrib.auth.context_processors.auth',

 'django.contrib.messages.context_processors.messages',

 ],

 },

 },

]
3.Security
# SECURITY WARNING: don't run with debug turned on in production!

DEBUG = True


ALLOWED_HOSTS = ['*']
4.Internationalization
LANGUAGE_CODE = 'en-us'

# Change the time zone

TIME_ZONE = 'Asia/Shanghai'


USE_I18N = True


USE_L10N = True

# Change the time zone

USE_TZ = False
from django.db import models


# Create your models here.


class CpuInfo(models.Model):

 # CPU Information

 time = models.DateTimeField()

 host = models.CharField(max_length=40)

 usage_system = models.FloatField(null=True)

 usage_user = models.FloatField(null=True)

 usage_softirq = models.FloatField(null=True)

 usage_iowait = models.FloatField(null=True)


class MemoryInfo(models.Model):

 # Memory information

 time = models.DateTimeField()

 host = models.CharField(max_length=40)

 used_percent = models.FloatField(null=True)


class ProcstatInfo(models.Model):

 # Process information

 time = models.DateTimeField()

 host = models.CharField(max_length=100)

 exe = models.CharField(max_length=40)

 pid = models.FloatField()

 cpu_usage = models.FloatField(null=True)

 memory_rss = models.FloatField(null=True)
1.Terminal Run under manager.py
# python3 manager.py mkmigrations web

# python3 manager.py migrate
2. Inquire about mysql
mysql> show tables;

ERROR 2006 (HY000): MySQL server has gone away

No connection. Trying to reconnect...

Connection id: 449745

Current database: perf_monitor


+----------------------------+

| Tables_in_perf_monitor |

+----------------------------+

| auth_group |

| auth_group_permissions |

| auth_permission |

| auth_user |

| auth_user_groups |

| auth_user_user_permissions |

| django_admin_log |

| django_content_type |

| django_migrations |

| django_session |

| web_cpuinfo |

| web_memoryinfo |

| web_procstatinfo |

+----------------------------+

13 rows in set (0.51 sec)


mysql>
Four 、 views.py
Create two views, A display CPU And memory information ; Another real process information
# Author: Allan

# Datetime: 2019-05-21

import time

import json

from django.shortcuts import render

from web import models


# Create your views here.


def show_procstat(request):

 servers = ['rotestZone01', 'rotestZone02']

 procstat_ret = {}

 for server in servers:

 procstat_info = models.ProcstatInfo.objects.filter(host=server)

 procstat_exe = {}

 for row in procstat_info:

 temp_time = int(time.mktime(row.time.timetuple())) * 1000

 key = str(row.exe) + '_' + str(int(row.pid))

 if key not in procstat_exe:

 procstat_exe[key] = {}

 procstat_exe[key]['cpu_usage'] = []

 procstat_exe[key]['memory_rss'] = []

 procstat_exe[key]['cpu_usage'].append([temp_time, row.cpu_usage])

 procstat_exe[key]['memory_rss'].append([temp_time, row.memory_rss])

 procstat_ret[server] = procstat_exe


 return render(request, 'show_procstat.html', {"procstat_ret": json.dumps(procstat_ret)})


def show_servers(request):

 servers = ['rotestZone01', 'rotestZone02']

 server_res = {}

 cpu_res = {}

 mem_res = {}

 for server in servers:

 cpu_info = models.CpuInfo.objects.filter(host=server)

 cpu_ret = {}

 usage_system = []

 usage_user = []

 usage_softirq = []

 usage_iowait = []

 for row in cpu_info:

 temp_time = int(time.mktime(row.time.timetuple())) * 1000

 usage_system.append([temp_time, row.usage_system])

 usage_user.append([temp_time, row.usage_user])

 usage_softirq.append([temp_time, row.usage_softirq])

 usage_iowait.append([temp_time, row.usage_iowait])

 cpu_ret['usage_system'] = usage_system

 cpu_ret['usage_user'] = usage_user

 cpu_ret['usage_softirq'] = usage_softirq

 cpu_ret['usage_iowait'] = usage_iowait

 cpu_res[server] = cpu_ret


 mem_info = models.MemoryInfo.objects.filter(host=server)

 mem_ret = []

 for row in mem_info:

 temp_time = int(time.mktime(row.time.timetuple()))*1000

 mem_ret.append([temp_time, row.used_percent])

 mem_res[server] = mem_ret


 server_res['cpu_res'] = cpu_res

 server_res['mem_res'] = mem_res


 return render(request, 'show_servers.html', {"server_res": json.dumps(server_res)})
5、 ... and 、 establish html Template
Create two html Template , A display CPU And memory information ; Another real process information
<html xmlns="http://www.w3.org/1999/html">

<head>

<meta charset="UTF-8" />

<title> Server monitoring information </title>

<script src="https://code.jquery.com/jquery-3.1.1.min.js"></script>

<script src="https://code.highcharts.com/highcharts.js"></script>

<script src="https://code.highcharts.com/modules/exporting.js"></script>

<script src="https://code.highcharts.com/modules/export-data.js"></script>

<script language="JavaScript">

$(document).ready(function() {

 $("#servers").change(function (){

 var selected = $(this).children('option:selected').val();

 var server_res = jQuery.parseJSON('{{ server_res|safe }}');


 var cpu_res = server_res['cpu_res']

 var cpu_info = cpu_res[selected]


 Highcharts.setOptions({

 global:{

 useUTC: false

 }

 });

 Highcharts.chart('cpu', {

 chart: {

 zoomType: 'x'

 },

 title: {

 text: selected + ': CPU Information '

 },

 subtitle: {

 text: document.ontouchstart === undefined ?

 'Click and drag in the plot area to zoom in' : 'Pinch the chart to zoom in'

 },

 xAxis: {

 type: 'datetime'

 },

 yAxis: {

 title: {

 text: ' Usage rate (%)'

 }

 },

 legend: {

 enabled: false

 },

 plotOptions: {

 area: {

 fillColor: {

 linearGradient: {

 x1: 0,

 y1: 0,

 x2: 0,

 y2: 1

 },

 stops: [

 [0, Highcharts.getOptions().colors[0]],

 [1, Highcharts.Color(Highcharts.getOptions().colors[0]).setOpacity(0).get('rgba')]

 ]

 },

 marker: {

 radius: 2

 },

 lineWidth: 1,

 states: {

 hover: {

 lineWidth: 1

 }

 },

 threshold: null

 }

 },


 series: [

 {

 type: 'area',

 name: 'usage_system',

 data: cpu_info['usage_system']

 },

 {

 type: 'area',

 name: 'usage_user',

 data: cpu_info['usage_user']

 },

 {

 type: 'area',

 name: 'usage_softirq',

 data: cpu_info['usage_softirq']

 },

 {

 type: 'area',

 name: 'usage_iowait',

 data: cpu_info['usage_iowait']

 }]

 });


 var mem_res = server_res['mem_res']

 var mem_info = mem_res[selected]

 Highcharts.chart('mem', {

 chart: {

 zoomType: 'x'

 },

 title: {

 text: selected + ': Memory information '

 },

 subtitle: {

 text: document.ontouchstart === undefined ?

 'Click and drag in the plot area to zoom in' : 'Pinch the chart to zoom in'

 },

 xAxis: {

 type: 'datetime'

 },

 yAxis: {

 title: {

 text: ' Usage rate (%)'

 }

 },

 legend: {

 enabled: false

 },

 plotOptions: {

 area: {

 fillColor: {

 linearGradient: {

 x1: 0,

 y1: 0,

 x2: 0,

 y2: 1

 },

 stops: [

 [0, Highcharts.getOptions().colors[0]],

 [1, Highcharts.Color(Highcharts.getOptions().colors[0]).setOpacity(0).get('rgba')]

 ]

 },

 marker: {

 radius: 2

 },

 lineWidth: 1,

 states: {

 hover: {

 lineWidth: 1

 }

 },

 threshold: null

 }

 },


 series: [{

 type: 'area',

 name: 'used_percent',

 data: mem_info

 }]

 });

 });

});

</script>

</head>

<body>

<div><H2> Server monitoring information </H2></div>

<select id="servers">

 <option value="servers"> Please select the server to monitor </option>

 <option value="rotestZone01">rotestZone01</option>

 <option value="rotestZone02">rotestZone02</option>

</select>


<div id="cpu" ></div>

<div id="mem" ></div>

</body>

</html>
<html xmlns="http://www.w3.org/1999/html" xmlns="http://www.w3.org/1999/html">

<head>

<meta charset="UTF-8" />

<title> Server monitoring information </title>

<script src="https://code.jquery.com/jquery-3.1.1.min.js"></script>

<script src="https://code.highcharts.com/highcharts.js"></script>

<script src="https://code.highcharts.com/modules/exporting.js"></script>

<script src="https://code.highcharts.com/modules/export-data.js"></script>

<script language="JavaScript">

$(document).ready(function() {

 $("#servers").change(function (){

 var selected = $(this).children('option:selected').val();

 var server_res = jQuery.parseJSON('{{ procstat_ret|safe }}');

 var xServers = server_res[selected]


 var obj=document.getElementById('processes');

 if (obj.options.length != 1){

 obj.options.length=1;

 }

 for(var key in xServers)

 {

 obj.options.add(new Option(key,key));

 }


 $("#processes").change(function (){

 var procSelected = $(this).children('option:selected').val();

 var dataMem = new Array();

 var dataCpu = new Array();

 for(var key in xServers)

 {

 if (key == procSelected){

 dataCpu = xServers[key]['cpu_usage']

 dataMem = xServers[key]['memory_rss'];

 break;

 }

 }

 Highcharts.chart('cpu', {

 chart: {

 zoomType: 'x'

 },

 title: {

 text: selected + ': CPU Information '

 },

 subtitle: {

 text: document.ontouchstart === undefined ?

 'Click and drag in the plot area to zoom in' : 'Pinch the chart to zoom in'

 },

 xAxis: {

 type: 'datetime'

 },

 yAxis: {

 title: {

 text: ' Usage rate (%)'

 }

 },

 legend: {

 enabled: false

 },

 plotOptions: {

 area: {

 fillColor: {

 linearGradient: {

 x1: 0,

 y1: 0,

 x2: 0,

 y2: 1

 },

 stops: [

 [0, Highcharts.getOptions().colors[0]],

 [1, Highcharts.Color(Highcharts.getOptions().colors[0]).setOpacity(0).get('rgba')]

 ]

 },

 marker: {

 radius: 2

 },

 lineWidth: 1,

 states: {

 hover: {

 lineWidth: 1

 }

 },

 threshold: null

 }

 },


 series: [

 {

 type: 'area',

 name: 'cpu_usage',

 data: dataCpu

 }]

 });


 Highcharts.chart('mem', {

 chart: {

 zoomType: 'x'

 },

 title: {

 text: selected + ': Memory information '

 },

 subtitle: {

 text: document.ontouchstart === undefined ?

 'Click and drag in the plot area to zoom in' : 'Pinch the chart to zoom in'

 },

 xAxis: {

 type: 'datetime'

 },

 yAxis: {

 title: {

 text: ' Usage rate (%)'

 }

 },

 legend: {

 enabled: false

 },

 plotOptions: {

 area: {

 fillColor: {

 linearGradient: {

 x1: 0,

 y1: 0,

 x2: 0,

 y2: 1

 },

 stops: [

 [0, Highcharts.getOptions().colors[0]],

 [1, Highcharts.Color(Highcharts.getOptions().colors[0]).setOpacity(0).get('rgba')]

 ]

 },

 marker: {

 radius: 2

 },

 lineWidth: 1,

 states: {

 hover: {

 lineWidth: 1

 }

 },

 threshold: null

 }

 },


 series: [{

 type: 'area',

 name: 'memory_rss',

 data: dataMem

 }]

 });

 });


 });

});

</script>

</head>

<body>

<div><H2> Server monitoring information </H2></div>


<div id="monitor">

 <select id="servers">

 <option value="server"> Please select the server to monitor </option>

 <option value="rotestZone01">rotestZone01</option>

 <option value="rotestZone02">rotestZone02</option>

 </select>

 <select id="processes">

 <option value="process"> Please select the process to monitor </option>

 </select>

</div>


<div id="cpu" ></div>

<div id="mem" ></div>

</body>

</html>
# Author: Allan

# Datetime: 2019-05-21

from django.contrib import admin

from django.urls import path

from web import views


urlpatterns = [

 # path('admin/', admin.site.urls),

 path('show_servers', views.show_servers),

 path('show_procstat', views.show_procstat),

]
# python3 manager.py runserver
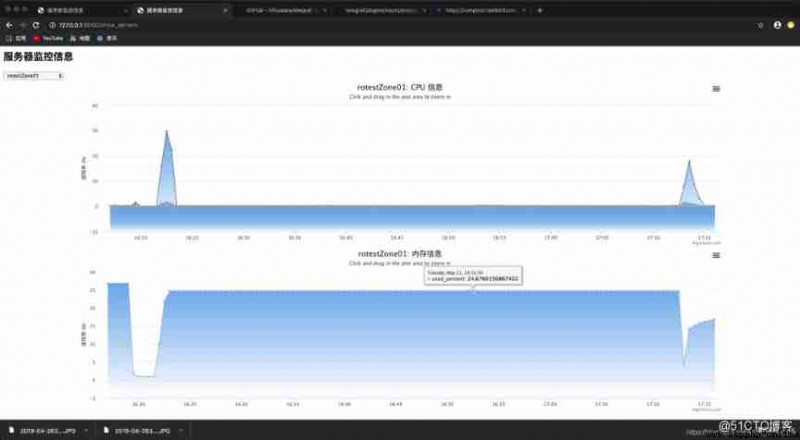
CPU And memory information

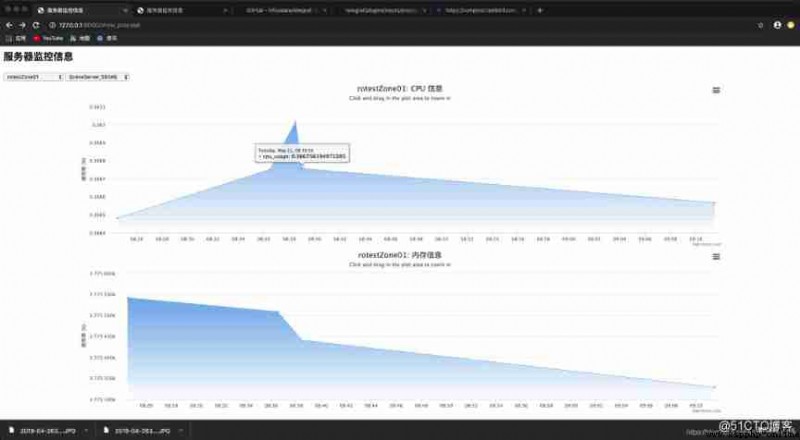
Process information

END

Python Full stack technical training

https://edu.51cto.com/sd/3a4c4