Good morning, everyone 、 Good afternoon 、 Good evening ~
import requests # Send network request module
import json
import pprint # Format output module
import pandas as pd # Data analysis is a very important module
Target data to crawl today
https://news.qq.com/zt2020/page/feiyan.htm#/
url = 'https://view.inews.qq.com/g2/getOnsInfo?name=disease_h5&_=1638361138568'
response = requests.get(url, verify=False)
json_data = response.json()['data']
json_data = json.loads(json_data)
china_data = json_data['areaTree'][0]['children'] # list
data_set = []
for i in china_data:
data_dict = {
}
# Area name
Source code 、 answer 、 course 、 Can dress if necessary :832157862
data_dict['province'] = i['name']
# Add confirmation
data_dict['nowConfirm'] = i['total']['nowConfirm']
# The number of deaths
data_dict['dead'] = i['total']['dead']
# The number of people cured
data_dict['heal'] = i['total']['heal']
# mortality
data_dict['deadRate'] = i['total']['deadRate']
# Cure rate
data_dict['healRate'] = i['total']['healRate']
data_set.append(data_dict)
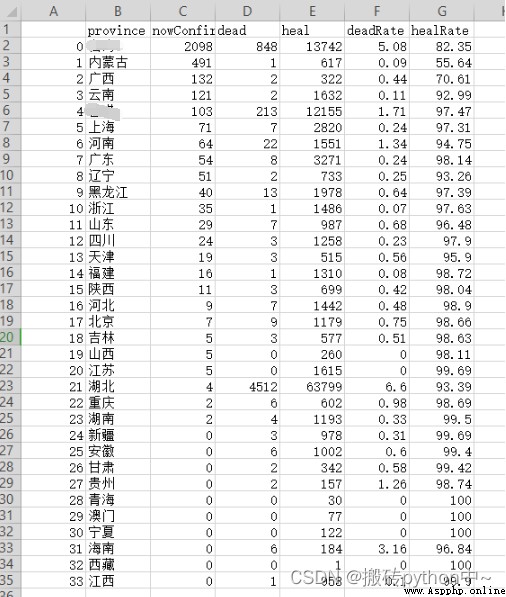
df = pd.DataFrame(data_set)
df.to_csv('data.csv')
from pyecharts import options as opts
Source code 、 answer 、 course 、 Can dress if necessary :832157862
from pyecharts.charts import Bar,Line,Pie,Map,Grid
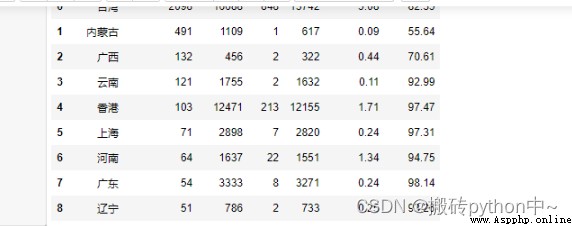
df2 = df.sort_values(by=['nowConfirm'],ascending=False)[:9]
df2
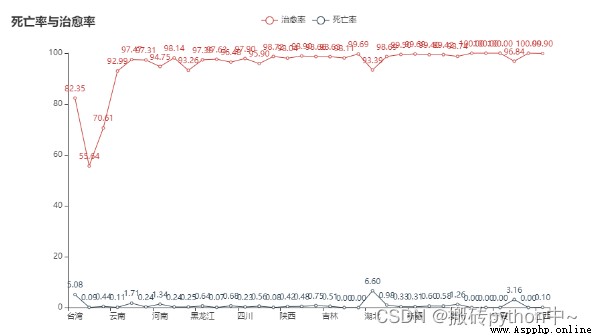
line = (
Line()
.add_xaxis(list(df['province'].values))
.add_yaxis(" Cure rate ", df['healRate'].values.tolist())
.add_yaxis(" mortality ", df['deadRate'].values.tolist())
.set_global_opts(
title_opts=opts.TitleOpts(title=" Mortality and cure rate "),
)
)
line.render_notebook()
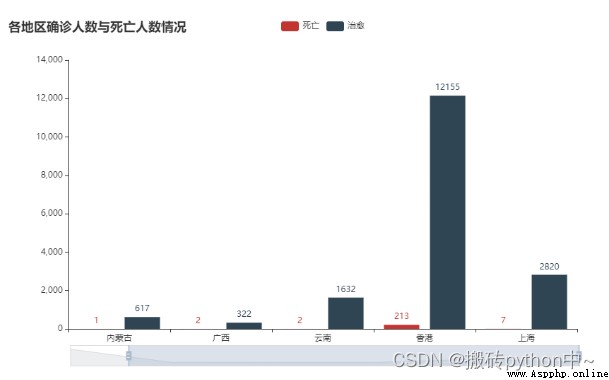
bar = (
Bar()
.add_xaxis(list(df['province'].values)[:6])
.add_yaxis(" Death ", df['dead'].values.tolist()[:6])
.add_yaxis(" Cure ", df['heal'].values.tolist()[:6])
.set_global_opts(
Source code 、 answer 、 You can dress up if necessary :832157862
title_opts=opts.TitleOpts(title=" Number of confirmed cases and deaths in various regions "),
datazoom_opts=[opts.DataZoomOpts()],
)
)
bar.render_notebook()
Okay , My article ends here !
There are more suggestions or questions to comment on or send me a private letter ! Come on together and work hard (ง •_•)ง
If you like, just pay attention to the blogger , Or like the collection and comment on my article !!!