scatter The codes for drawing the scatter chart are as follows :
import matplotlib.pyplot as pltplt.scatter(x,y, s = 20 c='b' marker=‘o' cmap=None, norm=None, vmin=None, vmax=None, alpha=None, linewidths=None,)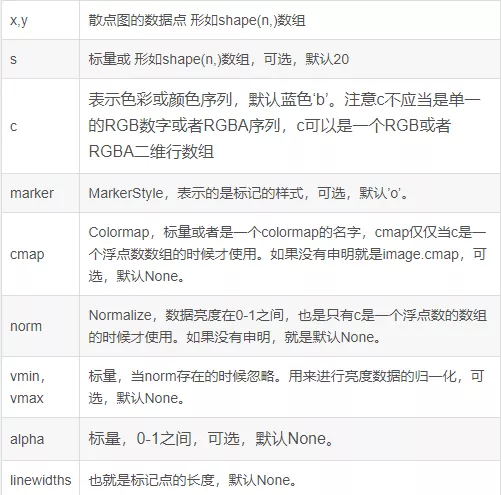
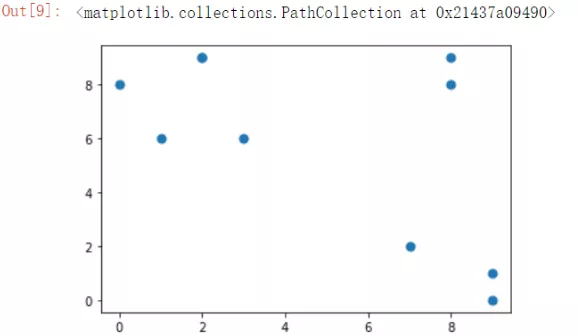
import numpy as npimport pandas as pdimport matplotlib.pyplot as pltx=np.random.randint(0,10,10)y=np.random.randint(0,10,10)print(x)print(y)plt.scatter(x,y,s=50) Default shape dot , Color b Blue , size 50out:
[5 1 5 3 1 5 0 5 4 7]
[8 2 7 7 8 6 3 8 5 9]
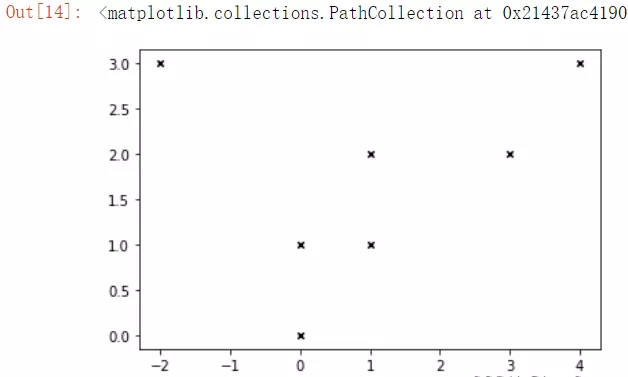
import numpy as npimport pandas as pdimport matplotlib.pyplot as pltx = np.array([[0,0],[0,1],[1,1],[3,2],[-2,3],[1,2],[4,3]])print(x)plt.scatter(x[:,0],x[:,1],marker='x',color='k',s=20)# The shape of the dot x, The color black , size 20out:
[[ 0 0]
[ 0 1]
[ 1 1]
[ 3 2]
[-2 3]
[ 1 2]
[ 4 3]]
This is about python utilize scatter This is the end of the article on drawing scatter charts , More about python scatter Please search the previous articles of the software development network or continue to browse the relevant articles below. I hope you will support the software development network more in the future !