Hi. , Hello, everyone ! This is the little panda
This has its own set of templates < Universal >
# Import data request module
import requests
# Import data analysis module
import parsel
import re
import csv
f = open(' Second hand house multi page .csv', mode='a', encoding='utf-8', newline='')
csv_writer = csv.DictWriter(f, fieldnames=[
' title ',
' Selling point ',
' The total price ',
' The unit price ',
' House type ',
' floor ',
' Number of floors in total ',
' decorate ',
' toward ',
' Construction time ',
' area ',
' community ',
' Area ',
' District ',
' The ratio of ladder households ',
' Is there an elevator ',
' House properties ',
' Details page ',
])
csv_writer.writeheader()
headers >>> What data is added to the request header , How to find it ?
User-Agent: The user agent Represents the basic identity of the browser … < It's equivalent to you entering the supermarket , Look at the health code or wear a mask >
If you don't add headers For some websites , You may be identified as your crawler , Be crawled back >>> No data available headers Dictionary data type
for page in range(1, 11):
url = f'https://cs.lianjia.com/ershoufang/pg{page}/'
headers = {
'User-Agent': 'Mozilla/5.0 (Windows NT 10.0; WOW64) AppleWebKit/537.36 (KHTML, like Gecko) Chrome/101.0.4951.54 Safari/537.36'
}
response = requests.get(url=url, headers=headers)
# print(response.text)
selector = parsel.Selector(response.text)
# Real mastery of css Selector parsing method In system courses, you need to learn 2.5 In hours or so
href = selector.css('.sellListContent li.clear .title a::attr(href)').getall()
for link in href:
# url = 'https://cs.lianjia.com/ershoufang/104108664407.html'
# Send a request
response = requests.get(url=link, headers=headers)
# print(response) # <Response [200]> The response object 200 The status code indicates that the request was successful
# get data
# print(response.text)
css Selectors >>> Extract data according to tag attribute content
 selector_1 = parsel.Selector(response.text) # Need to get html Convert string data to selector object
# print(selector)
# Copy it down and just navigate to the tag , I get the tag inside title attribute
try:
# body > div.sellDetailHeader > div > div > div.title > h1
title = selector_1.css('.main::text').get() # title
selling_point = selector_1.css('.sub::text').get() # Selling point
price = selector_1.css('.price .total::text').get() # The total price
unitPrice = selector_1.css('.unitPrice .unitPriceValue::text').get() # The unit price
house_type = selector_1.css('.room .mainInfo::text').get() # House type
subInfo = selector_1.css('.room .subInfo::text').get().split('/') # floor
floor = subInfo[0] # floor
num = re.findall('\d+', subInfo[1])[0] # Number of floors in total
furnish = selector_1.css('.type .subInfo::text').get().split('/')[-1] # decorate
face = selector_1.css('.type .mainInfo::text').get() # toward
date = re.findall('\d+', selector_1.css('.area .subInfo::text').get()) # Construction time
if len(date) == 0:
date = '0'
else:
date = date[0]
area = selector_1.css('.area .mainInfo::text').get().replace(' Square meters ', '') # area
community = selector_1.css('.communityName .info::text').get() # community
areaName_info = selector_1.css('.areaName .info a::text').getall() # Area
areaName = areaName_info[0] # District
region = areaName_info[1] # Area
scale = selector_1.css('div.content ul li:nth-child(10)::text').get() # The ratio of ladder households
elevator = selector_1.css('div.content ul li:nth-child(11)::text').get() # Is there an elevator
houseProperty = selector_1.css('div.content li:nth-child(2) span:nth-child(2)::text').get() # House properties
dit = {
' title ': title,
' Selling point ': selling_point,
' The total price ': price,
' The unit price ': unitPrice,
' House type ': house_type,
' floor ': floor,
' Number of floors in total ': num,
' decorate ': furnish,
' toward ': face,
' Construction time ': date,
' area ': area,
' community ': community,
' Area ': region,
' District ': areaName,
' The ratio of ladder households ': scale,
' Is there an elevator ': elevator,
' House properties ': houseProperty,
' Details page ': link,
}
csv_writer.writerow(dit)
print(
title, selling_point, price, unitPrice, house_type, subInfo, furnish, face,
date, area, community, region, scale, elevator, houseProperty, link
)
except:
pass
stay pycharm It's open inside , Just take a look at the renderings , Not in the ipynb It's nice to open inside ~
2.1 Broken line diagram
# Draw a line chart of the total price of second-hand houses in each district , Whether there is an elevator as the evaluation standard
plt.figure(figsize=(12,6))
# Add title
plt.title(" Ranking of total price of second-hand houses in each district ")
sns.lineplot(x=" District ", y=" The total price ", data=data,hue=data[' Is there an elevator '])
# Generally, the price of a house with an elevator is higher than that of a house without an elevator , But Qingyang District in the figure below 、 Taurus is the exception .
# This diagram can also explain what is shown in the following thermal diagram “ Number of floors in total ” And “ The unit price ” There is a certain relationship , Because there are elevators, it means that the number of common floors is high .
2.1.1 design sketch 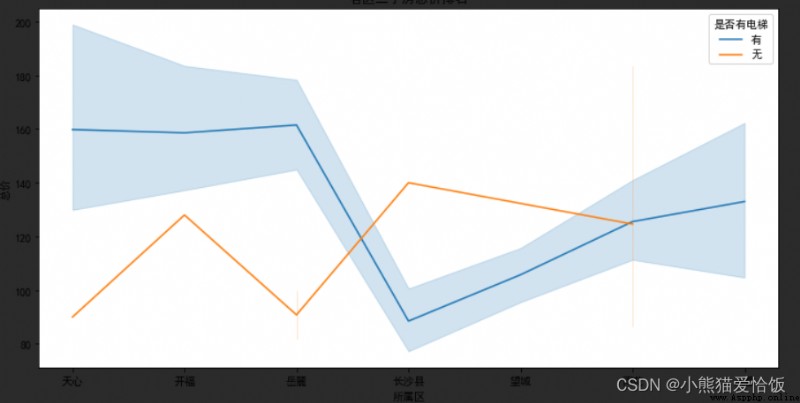
More visual codes can be obtained for free by clicking the flowing text on the right or scanning below ~
2.2 Comparison of the number of house types in each district
# Comparison of the number of house types in each district
plt.figure(figsize=(16,6))
huxing_num = data.groupby([data[' District '],data[' House type ']])[' community '].count().reset_index().rename(columns={' District ':' District ',' House type ':' House type ',' community ':' Number '})
# print(huxing_num)
sns.barplot(x=" House type ", y=" Number ", data=huxing_num,order=sort,hue=huxing_num[' District '])
# The following figure shows the of Tianfu new area and high tech Zone “3 room 2 hall ” The number of houses is significantly higher than that in other districts , You can refer to the number of different rooms in each district , Targeted screening of listings .
2.2.1 design sketch 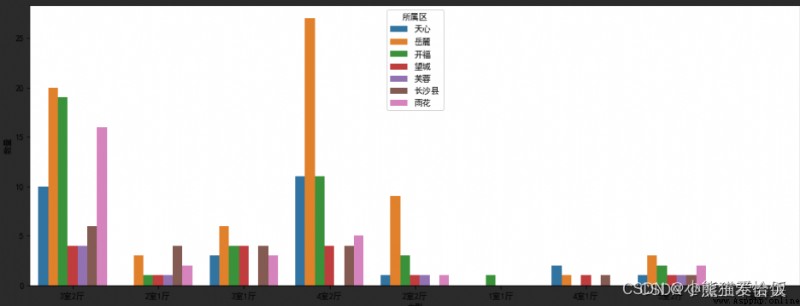
2.3 Bar chart between house property and unit price
# Draw a bar chart between house properties and unit price
plt.figure(figsize=(12,6))
shuxing = data.groupby(data[' House properties '])[' The unit price '].mean().reset_index()
sns.barplot(x=' House properties ',y=' The unit price ',data=shuxing)
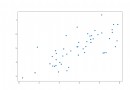
2.4 Draw a heat map
# Draw a heat map , Observe the relationship between other numerical variables and unit price
import numpy as np
cols = data.corr().nlargest(10,' The unit price ')[' The unit price '].index# Local operation , Step by step index
cm = np.corrcoef(data[cols].values.T)
plt.subplots(figsize=(12,6))
sns.heatmap(cm, vmax=0.9,annot=True,square=True,annot_kws={'size':10},xticklabels=cols.values,yticklabels=cols.values)
# The heat map shows the unit price and total price 、 Number of floors in total 、 Construction time 、 It depends on the area , These relationships are also confirmed in the above analysis
2.4.1 design sketch 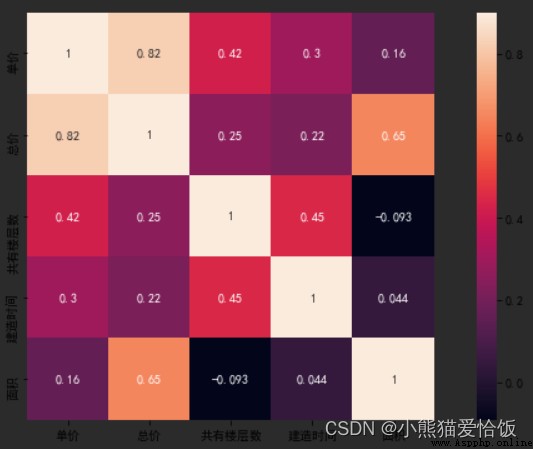
2.5 Make a cloud of words
# draw “ House selling points ” Clouds of words
import jieba
from PIL import Image
import wordcloud
text = ("".join(i for i in data[' Selling point '])) # Combine the column data together to form a string
# print(text)
cut = jieba.cut(text)
img = Image.open('1.png') # Open the mask photo
img_array = np.array(img) # Convert the picture to an array
# Set the word cloud
wc = wordcloud.WordCloud(
background_color = 'white',
height = 800,
width = 400,# Set different pixels , The position of each word in the word cloud picture is also changing
mask = img_array,
font_path = 'msyh.ttc' # Font location :C:\Windows\Fonts
)
wc.generate_from_text(text)
plt.figure(figsize=(20,6)) # The setting of parameters will change the arrangement of picture words
plt.imshow(wc) # Put the word cloud on the mask picture
plt.axis('off') # Whether the axis is displayed
plt.show() # Display the generated word cloud image
# The cloud picture shows the characteristics of the house that can attract buyers, including “ The house is square ”、“ Good lighting ”、“ Middle floor ”、“ Refined decoration ”、“ vision ” etc.
2.5.1 design sketch