Data analysis is inseparable from data visualization , The one we use most often is pandas,matplotlib,pyecharts Of course, Tableau, See an article about plotly After drawing, I'm also eager to try , After checking the relevant information, I began to try to draw with it .
Plotly It is an online platform for data analysis and visualization , Very powerful , You can draw a lot of graphs online, such as bar graphs 、 Scatter plot 、 The pie chart 、 Histogram and so on . It also supports online editing , And many languages python、javascript、matlab、R Wait a lot API. It's in python It's easy to use in , Direct use pip install plotly That's all right. . It's best to recommend jupyter notebook Use in ,pycharm The operation is not very convenient . Use Plotly Can draw a lot like Tableau High quality map of :
plotly Drawing I tried to make a line chart 、 Scatter and histogram , Import library first :
from plotly.graph_objs import Scatter,Layout
import plotly
import plotly.offline as py
import numpy as np
import plotly.graph_objs as go
#setting offilne Offline mode
plotly.offline.init_notebook_mode(connected=True)
The above lines of code mainly refer to some libraries ,plotly There are online and offline modes , Online mode requires an account that can be edited in the cloud . The offline mode I chose ,plotly Set to offline Mode can be directly in notebook It shows .
N = 100
random_x = np.linspace(0,1,N)
random_y0 = np.random.randn(N)+5
random_y1 = np.random.randn(N)
random_y2 = np.random.randn(N)-5
#Create traces
trace0 = go.Scatter(
x = random_x,
y = random_y0,
mode = 'markers',
name = 'markers')
trace1 = go.Scatter(
x = random_x,
y = random_y1,
mode = 'lines+markers',
name = 'lines+markers'
)
trace2 = go.Scatter(
x = random_x,
y = random_y2,
mode = 'lines',
name = 'lines'
)
data = [trace0,trace1,trace2]
py.iplot(data)
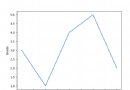
Broken line diagram
Random setting 4 Parameters , One x The number of axes and three y Random data of the axis , Make three different types of drawings .trace0 yes markers,trace1 yes lines and markers,trace3 yes lines. Then put the three diagrams on data In this list , call py.iplot(data) that will do . The default color of the drawn picture system is also very good-looking ~
trace1 = go.Scatter(
y = np.random.randn(500),
mode = 'markers',
marker = dict(
size = 16,
color = np.random.randn(500),
colorscale = 'Viridis',
showscale = True
)
)
data = [trace1]
py.iplot(data)
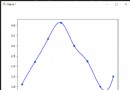
hold mode Set to markers It's a scatter plot , then marker Set a set of parameters , For example, the random range of colors , The size of the scatter , And legends and so on .
trace0 = go.Bar(
x = ['Jan','Feb','Mar','Apr', 'May','Jun',
'Jul','Aug','Sep','Oct','Nov','Dec'],
y = [20,14,25,16,18,22,19,15,12,16,14,17],
name = 'Primary Product',
marker=dict(
color = 'rgb(49,130,189)'
)
)
trace1 = go.Bar(
x = ['Jan','Feb','Mar','Apr', 'May','Jun',
'Jul','Aug','Sep','Oct','Nov','Dec'],
y = [19,14,22,14,16,19,15,14,10,12,12,16],
name = 'Secondary Product',
marker=dict(
color = 'rgb(204,204,204)'
)
)
data = [trace0,trace1]
py.iplot(data)
Histogram
Histogram is a commonly used graph ,plotly The way we draw the histogram is the same as us pandas The settings inside are a little similar , They intuitively reflect the difference between two productivity in different months . The drawing above is just plotly The tip of the iceberg , Are some of the most basic uses , It also has many cool uses and graphics , Especially with pandas The picture combined with the drawing is very beautiful . For example, some stocks K Line graph , If you are interested, you can study ~ Link here :https://plot.ly/python/
Link to the original text :https://www.jianshu.com/p/e5fb1b5c0957