This is my participation 2022 For the first time, the third challenge is 29 God , Check out the activity details 2022 For the first time, it's a challenge
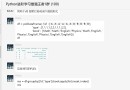
In the last article, we learned how to view the time consumption in code , Today we continue to talk about memory consumption in programs , Of course for python We also have ready-made bags Fabian Pedregosa With Robert Kern Of line_profiler For the model , Achieved a good Memory Analyzer .
First : adopt pip install :
$ pip install -U memory_profiler
$ pip install psutil
 Copy code
( It is recommended to install psutil package , Because it greatly improves memory_profiler Performance of ).
And line_profiler equally ,memory_profiler You are required to decorate the functions you are interested in with the following decorators @profile:
@profile
def primes(n):
...
...
 Copy code
To see how much memory your function uses , Please run the following command :
$ python -m memory_profiler primes.py
 Copy code
Once the program exits , You should see the output shown below :
Filename: primes.py
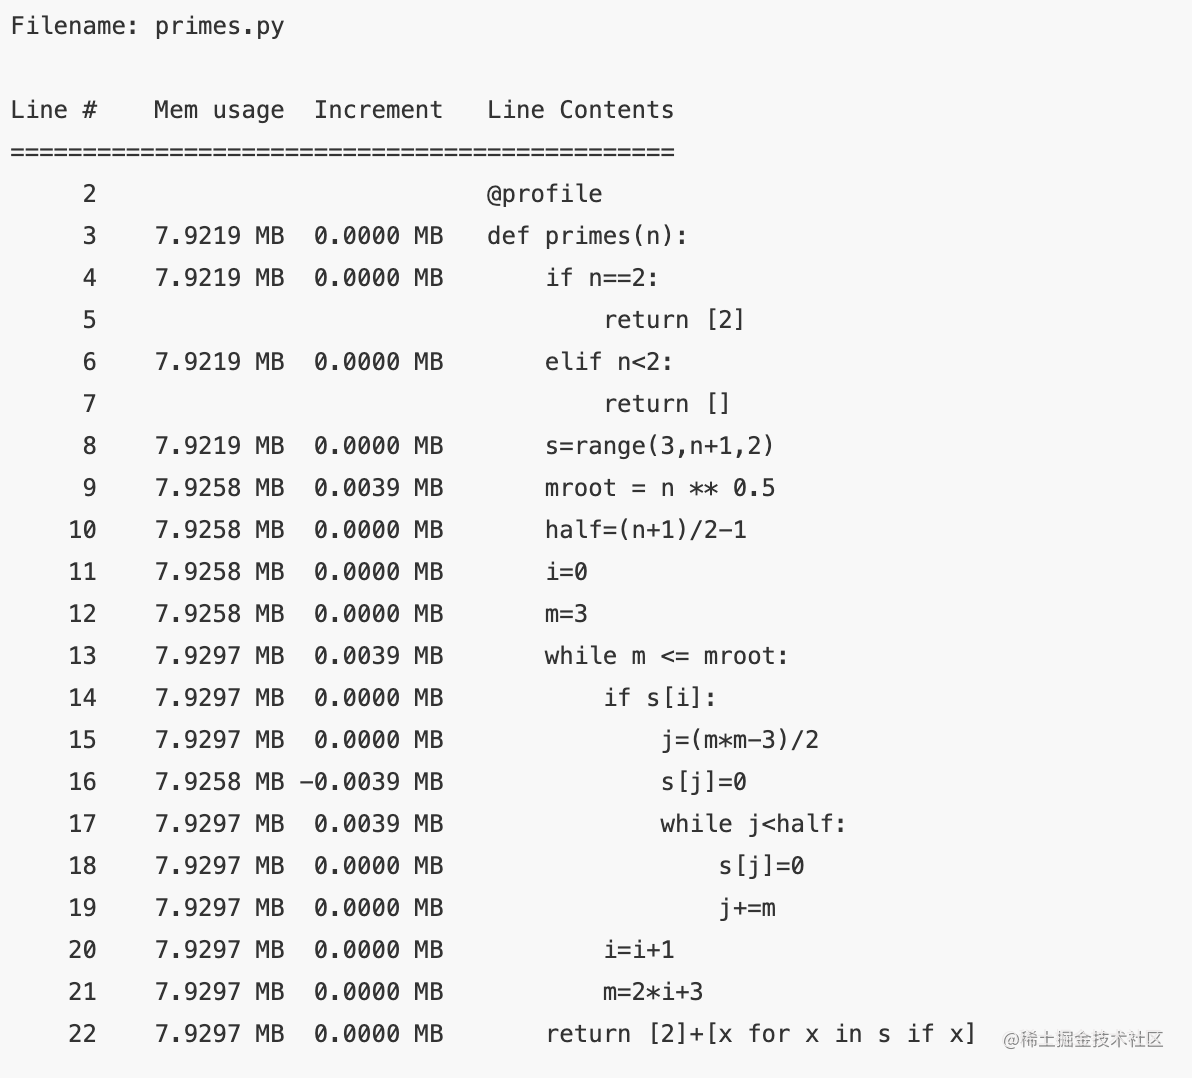
Line # Mem usage Increment Line Contents
==============================================
2 @profile
3 7.9219 MB 0.0000 MB def primes(n):
4 7.9219 MB 0.0000 MB if n==2:
5 return [2]
6 7.9219 MB 0.0000 MB elif n<2:
7 return []
8 7.9219 MB 0.0000 MB s=range(3,n+1,2)
9 7.9258 MB 0.0039 MB mroot = n ** 0.5
10 7.9258 MB 0.0000 MB half=(n+1)/2-1
11 7.9258 MB 0.0000 MB i=0
12 7.9258 MB 0.0000 MB m=3
13 7.9297 MB 0.0039 MB while m <= mroot:
14 7.9297 MB 0.0000 MB if s[i]:
15 7.9297 MB 0.0000 MB j=(m*m-3)/2
16 7.9258 MB -0.0039 MB s[j]=0
17 7.9297 MB 0.0039 MB while j<half:
18 7.9297 MB 0.0000 MB s[j]=0
19 7.9297 MB 0.0000 MB j+=m
20 7.9297 MB 0.0000 MB i=i+1
21 7.9297 MB 0.0000 MB m=2*i+3
22 7.9297 MB 0.0000 MB return [2]+[x for x in s if x]
Copy code Of course line_profiler,memory_profiler Both of these programs are from IPython Shortcuts accessed in , As shown below , This can save a lot of time and energy , You can analyze the code without modifying any source code
%load_ext memory_profiler
%load_ext line_profiler
Copy code cPython The interpreter uses reference counting as the main method of tracking memory . This means that each object contains a counter , This counter is incremented when the reference to the object is stored somewhere , And decrement when deleting the reference to the object . When the counter reaches zero ,cPython The interpreter knows that the object is no longer used , So it deletes the object and frees up the occupied memory .
If even the object is no longer used , References to objects still exist , Memory leaks often occur in programs .
Find these “ Memory leak ” The quickest way to use is by Marius Gedminas It's called objgraph Excellent tools . This tool allows you to view the number of objects in memory , And locate all the different locations in the code that hold references to these objects .
To start , First installation objgraph:
pip install objgraph
 Copy code
After installing this tool , Insert a statement into the code to call the debugger :
import pdb; pdb.set_trace()
Copy code At run time , You can check the most popular program by running the following command 20 Objects :
(pdb) import objgraph
(pdb) objgraph.show_most_common_types()
MyBigFatObject 20000
tuple 16938
function 4310
dict 2790
wrapper_descriptor 1181
builtin_function_or_method 934
weakref 764
list 634
method_descriptor 507
getset_descriptor 451
type 439
Copy code We can also see which objects are added or deleted between two points in time :
(pdb) import objgraph
(pdb) objgraph.show_growth()
.
.
.
(pdb) objgraph.show_growth() # this only shows objects that has been added or deleted since last show_growth() call
traceback 4 +2
KeyboardInterrupt 1 +1
frame 24 +1
list 667 +1
tuple 16969 +1
Copy code Continue along this route , We can also see where references to any given object are stored . Let's take the following simple program as an example :
x = [1]
y = [x, [x], {"a":x}]
import pdb; pdb.set_trace()
 Copy code
To see what holds a reference to a variable x, Please run the following objgraph.show_backref() function :
(pdb) import objgraph
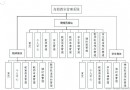
(pdb) objgraph.show_backref([x], filename="/tmp/backrefs.png")
Copy code The output of this command should be stored in PNG Images /tmp/backrefs.png, It should look like this :
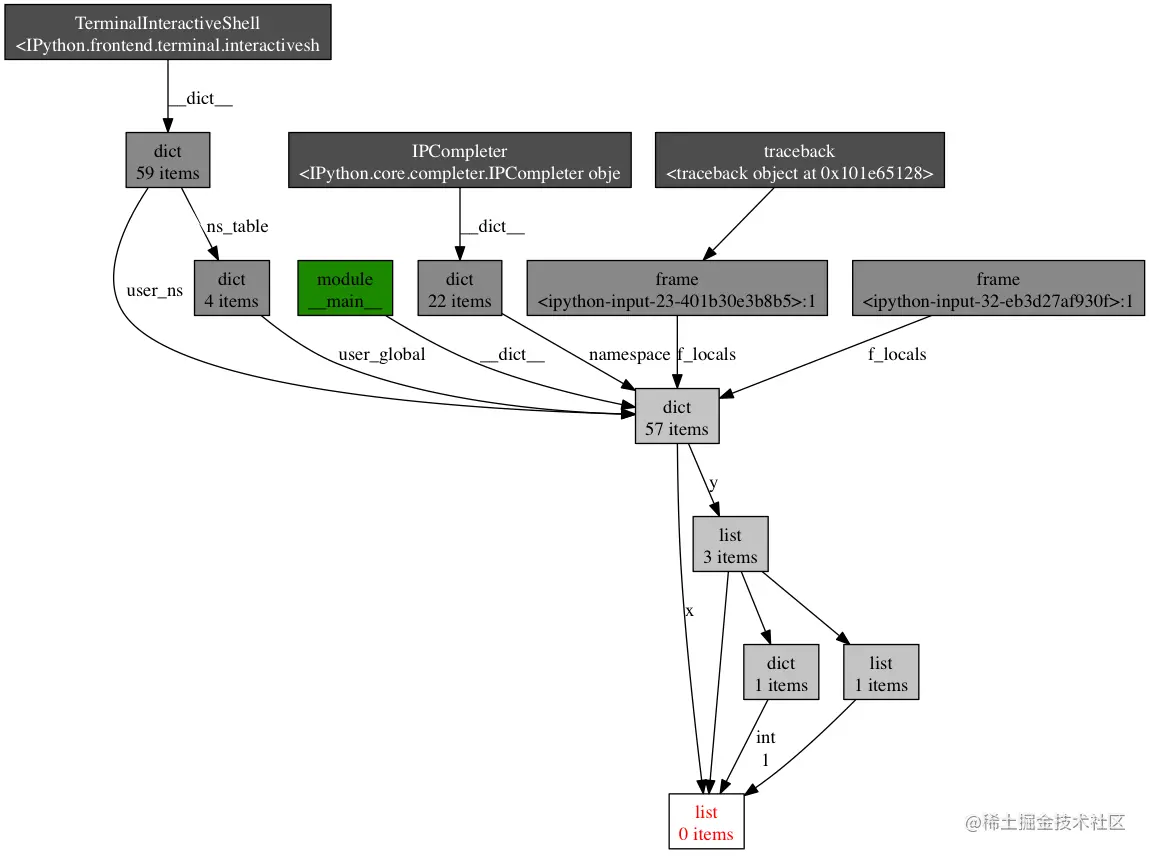
The box with red font at the bottom is the object we are interested in . We can see that it is referenced by symbols x once , Referenced by the list y Three times . If x Is the object that caused the memory leak , We can use this method to see why it is not automatically released by tracking all its references .