Load one Jupyter After the plug-in , You can do data analysis without writing code , Also help you generate the corresponding code ?
you 're right , You just need to load this file called Mito My gadget bag , use Python Do data analysis , Become and use Excel It's as simple as :
With Excel The spreadsheet represented by is the most important way to explore data sets 、 One of the most adaptive ways . It can help make the necessary changes to the data type 、 Create a new feature 、 Sort the data and create new features from existing features .
Follow the same idea above ,Mito It's a Jupyter-Lab Extension and Python library , It makes it possible to support GUI It's super easy to manipulate data in a spreadsheet environment .
Mito Appearance , It's like a general Python The power of 、 and Excel The ease of use of .
Just master Excel Usage of , Can use Python Data analysis function , Can also write out the code “ Pack out ”.
It makes up for Excel Several problems in data analysis defects :
Excel Unable to do big data analysis ( Large data sets are not handled well )
Excel slow
Excel Cannot easily create repeatable processes
meanwhile , And than SQL and Python more Simple 、 intuitive . After all, these professional tools are for 0 For beginners , It will take at least a few years , To get it all started .
In this paper , We will learn together :
How to set up Mito
how debug installation error
Use Mito Various functions provided
How the library generates for all operations on the dataset Python Equivalent code
Mito It's a Python library , Can pass pip Package manager installation . It needs to Python 3.6 And above . Besides , Installation is required on the system Nodejs, One JavaScript Runtime environment .
in addition , Can be in a separate environment ( A virtual environment ) Install this package in , Some dependency errors can be avoided . Next, run these commands in the terminal , Complete the installation .
1. Create an environment
I am using Conda Create a new environment . You can still use it Python Of “venv” To create a virtual environment .
conda create -n mitoenv python=3.8
2. Activate the environment
conda activate mitoenv
3. adopt pip install Mito
pip install mitoinstaller
4. function Mito Erection sequence
python -m mitoinstaller install
This process will take some time to install and set up Mito.
5. start-up Jupyter Lab
jupyter lab
When to start Jupyter Lab when , The following errors may be encountered :
.
.
.
File "c:userslenovoanaconda3envsmitoenvlibsite-packagesjupyter_corepaths.py", line 387, in win32_restrict_file_to_user
    import win32api
ImportError: DLL load failed while importing win32api: The specified module could not be found.
To fix this error , Just run the following command :
pip install --upgrade pywin32==225
If you encounter other difficulties , Please feel free to comment below . I'd be happy to help .
stay Jupyter Lab in , Create a new notebook and initialize Mitosheet:
import mitosheet
mitosheet.sheet()
for the first time , The system will prompt you to enter your email address to register :

After filling in the basic knowledge , Will be redirected to GUI The spreadsheet . Next, let's take a look at all the features of this interface , And learn how to generate Python Equivalent code .
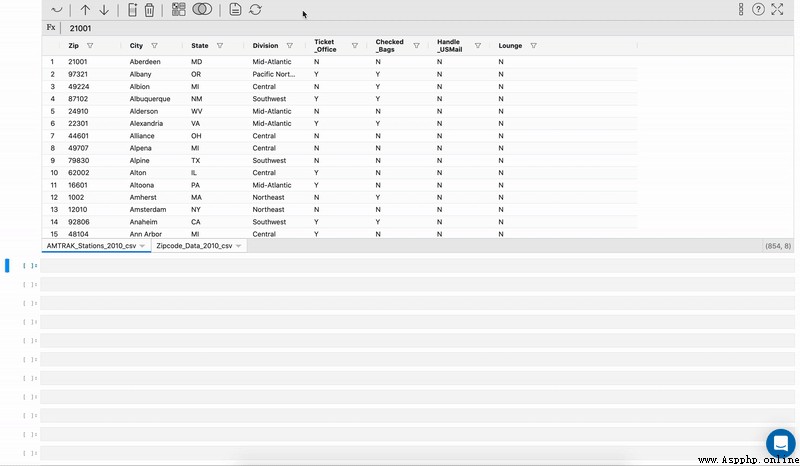
To be in MitoSheets Load data set in , Just click Import . There are two choices :
Add files from the current folder : This will list all... In the current directory CSV file , You can select File... From the drop-down menu .
Add files by file path : This will add only that specific file .
As shown in the figure below
If you look at the cells below , You'll find that Python The equivalent code imports a dataset using pandas Appropriate comments have been generated !

This is it. Mito The charm of , you are here Mitosheet Each operation performed in will be converted to Python Equivalent code ! Next, let's discuss in detail Mito All functions of .
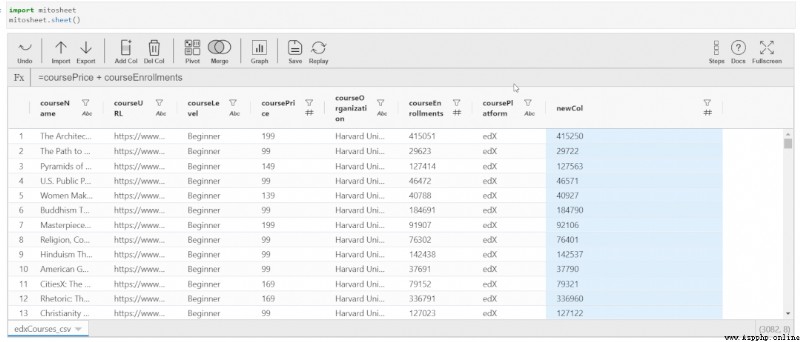
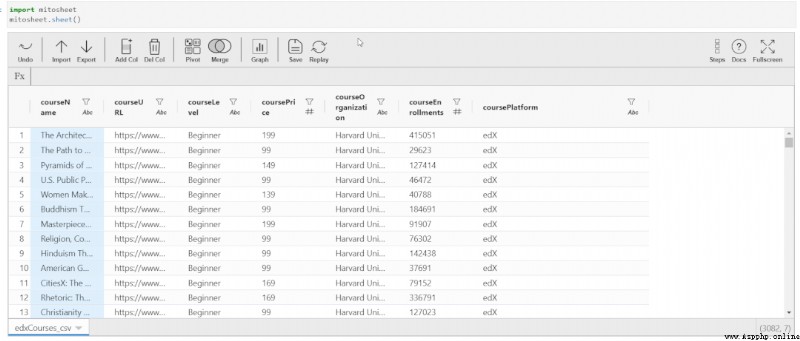
As in the Excel Like in a spreadsheet , You can add a new column , The column may be created from an existing column or feature . To be in Mito Do this in , Just click “Add Col” Button . The column is added next to the currently selected column . first , The column name will be an alphabet , All values of the column are zero .

Click the new column name ( Assigned alphabet )
The sidebar menu... Will pop up , You can edit the name of the column in it .
To update the contents of this column , Please click any cell in this column , Then enter the value . You can enter a constant value , You can also create feature sets based on existing feature values . If you want to create a value from an existing column , The column name... Is called directly using the operator to be executed .
The data type of the new column changes according to the assigned value .
Below GIF Demonstrates all of the above :

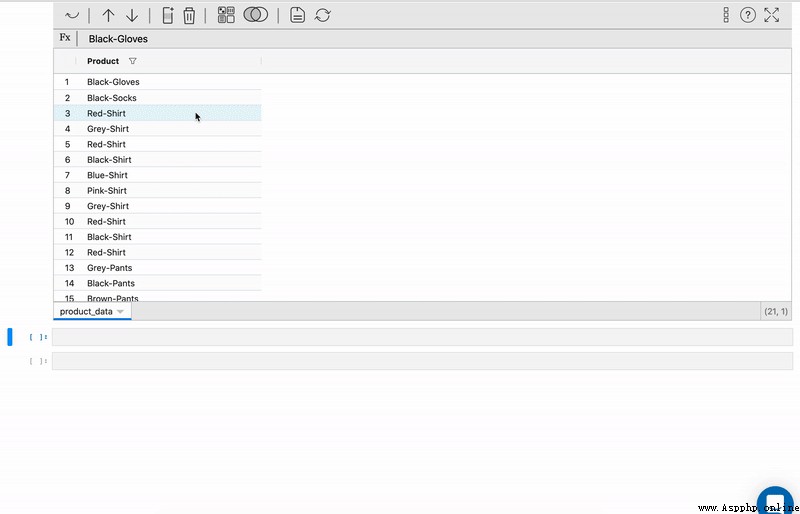
Select any column by clicking .
single click “Del Col”, This particular column will be deleted from the dataset .
Python Code
Generate a with correct comments in the next cell Python Equivalent code , The operations used to perform are :
# MITO CODE START (DO NOT EDIT)
from mitosheet import * # Import necessary functions from Mito
register_analysis('UUID-7bf77d26-84f4-48ed-b389-3f7a3b729753') # Let Mito know which analysis is being run
# Imported edxCourses.csv
import pandas as pd
edxCourses_csv = pd.read_csv('edxCourses.csv')
# Added column H to edxCourses_csv
edxCourses_csv.insert(7, 'H', 0)
# Renamed H to newCol in edxCourses_csv
edxCourses_csv.rename(columns={"H": "newCol"}, inplace=True)
# Set newCol in edxCourses_csv to =coursePrice + courseEnrollments
edxCourses_csv['newCol'] = edxCourses_csv['coursePrice'] + edxCourses_csv['courseEnrollments']
# Deleted column newCol from edxCourses_csv
edxCourses_csv.drop('newCol', axis=1, inplace=True)
# MITO CODE END (DO NOT EDIT)
PivotTable is an important excel function , It aggregates numerical variables according to another classification feature . To use Mito Create such a table ,
single click “Pivot” And select the source dataset ( The default load CSV)
Select the row of the PivotTable 、 Value and column . You can also select an aggregate function for the value column . All drop-down options , If sum 、 Average 、 The median 、 minimum value 、 Maximum 、 Both counts and standard deviations are available .
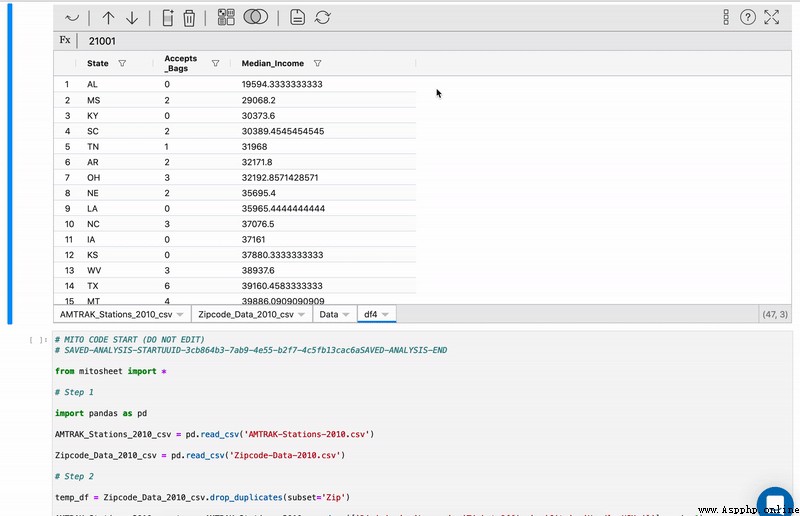
After selecting all the necessary fields , You will get a separate table , It contains the implementation of PivotTable .
Below GIF Demonstrates how to aggregate functions “ mean value ” Create a PivotTable :
# MITO CODE START (DO NOT EDIT)
from mitosheet import * # Import necessary functions from Mito
register_analysis('UUID-a35246c0-e0dc-436b-8667-076d4f08e0c1') # Let Mito know which analysis is being run
# Imported edxCourses.csv
import pandas as pd
edxCourses_csv = pd.read_csv('edxCourses.csv')
# Pivoted edxCourses_csv into df2
pivot_table = edxCourses_csv.pivot_table(
    index=['courseOrganization'],
    values=['coursePrice'],
    aggfunc={'coursePrice': 'mean'}
)
# Reset the column name and the indexes
df2 = pivot_table.rename_axis(None, axis=1).reset_index()
# MITO CODE END (DO NOT EDIT)
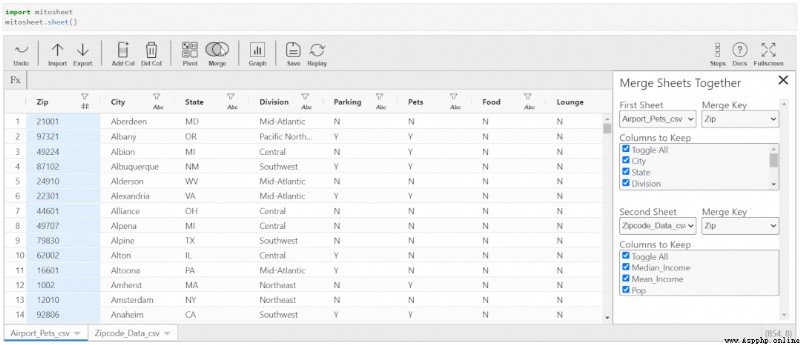
Merging data sets is an important part of data science projects . Usually , Data sets are divided into different tables , To increase the accessibility and readability of information . Merge Mitosheets be prone to .
single click “Merge” And select the data source .
You need to specify the key to merge .
You can also select the columns to be retained after merging from the data source . By default , All columns will remain in the merged dataset .
# MITO CODE START (DO NOT EDIT)
from mitosheet import * # Import necessary functions from Mito
register_analysis('UUID-88ac4a92-062f-4ed8-a55d-729394975740') # Let Mito know which analysis is being run
# Imported Airport-Pets.csv, Zipcode-Data.csv
import pandas as pd
Airport_Pets_csv = pd.read_csv('Airport-Pets.csv')
Zipcode_Data_csv = pd.read_csv('Zipcode-Data.csv')
# Merged Airport_Pets_csv and Zipcode_Data_csv
temp_df = Zipcode_Data_csv.drop_duplicates(subset='Zip')
Airport_Pets_csv_tmp = Airport_Pets_csv.drop(['State', 'Division'], axis=1)
Zipcode_Data_csv_tmp = temp_df.drop(['Mean_Income', 'Pop'], axis=1)
df3 = Airport_Pets_csv_tmp.merge(Zipcode_Data_csv_tmp, left_on=['Zip'], right_on=['Zip'], how='left', suffixes=['_Airport_Pets_csv', '_Zipcode_Data_csv'])
# MITO CODE END (DO NOT EDIT)
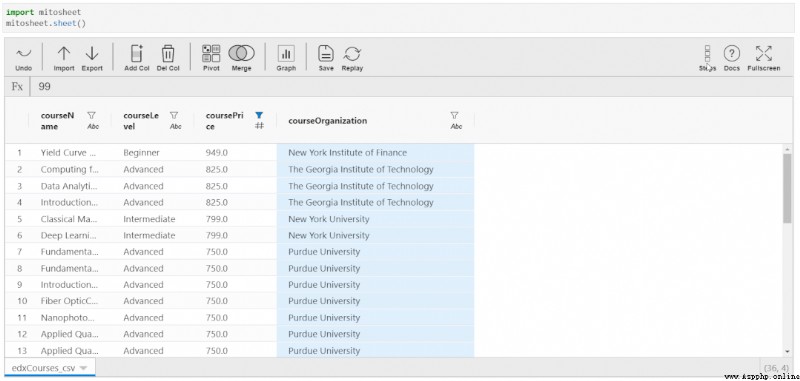
You can change the data type of existing columns , Sort columns in ascending or descending order , Or filter them through boundary conditions . stay Mito All of these are simple , You can do this by selecting the options on the screen GUI It's done by itself .
Click the desired column
You will see a list of data types . You can select any data type from the drop-down list as needed , This data type will be applied to the entire column .
Next, you can sort the data in ascending or descending order by selecting the options provided .
You can also use custom filters to filter data .

# MITO CODE START (DO NOT EDIT)
from mitosheet import * # Import necessary functions from Mito
register_analysis('UUID-cc414267-d9aa-4017-8890-ee3b7461c15b') # Let Mito know which analysis is being run
# Imported edxCourses.csv
import pandas as pd
edxCourses_csv = pd.read_csv('edxCourses.csv')
# Changed coursePrice from int64 to float
edxCourses_csv['coursePrice'] = edxCourses_csv['coursePrice'].astype('float')
# Sorted coursePrice in edxCourses_csv in descending order
edxCourses_csv = edxCourses_csv.sort_values(by='coursePrice', ascending=False, na_position='first')
edxCourses_csv = edxCourses_csv.reset_index(drop=True)
# Filtered coursePrice in edxCourses_csv
edxCourses_csv = edxCourses_csv[edxCourses_csv['coursePrice'] >= 500]
edxCourses_csv = edxCourses_csv.reset_index(drop=True)
# MITO CODE END (DO NOT EDIT)
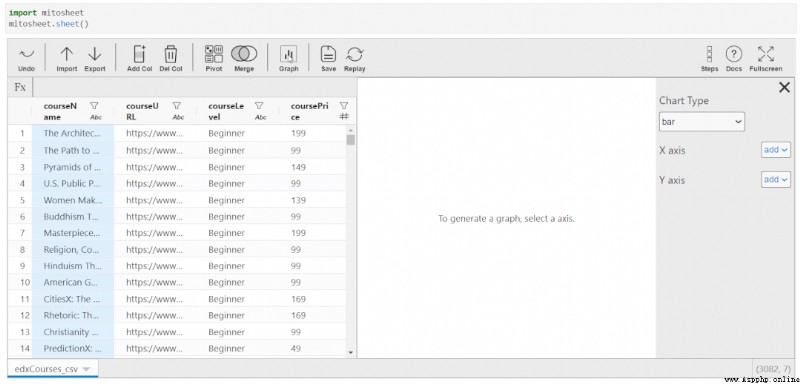
You can also generate graphics directly in this extension , Without writing drawing logic . By default , All graphs generated by this extension use Plotly To make the . This means that the drawing is interactive , It can be modified immediately .
Be careful , There is no such thing as an operation column , Generate graphic code in the next cell ( Maybe developers will push this code in future updates )
have access to Mito Generate two types of graphs :
You will see a sidebar menu , Used to select the drawing type and the corresponding axis to be selected .
When you click on the column name in the spreadsheet , You can see the filter and sorting options . But if you navigate to “Summary Stats”, The line chart or bar chart and the summary of variables will be displayed according to the type of variables . This summary is changed to text and has no text variables .
All transformations made to the dataset can be saved and used for other similar datasets . This is in Excel Macro or VBA In the form of . You can also complete the same operation through these functions .

The file is Python Compiling , Instead of using something more difficult to understand VBA.
To repeat the above steps , It's very easy ,Mito Bring their own “ Repeat the saved analysis steps ” function , You can analyze other data in the same way with one click . This feature is the most interesting . You can actually track in Mitosheet All transformations applied in . The list of all actions has the appropriate title .
Besides , You can view this particular step ! This means that suppose you change some columns , Then deleted them . You can go back to the undeleted time .
Come here , Just learn a new tool with Yunduo “Mito”. Used in Python Implement spreadsheet like functions in the environment , And generate the equivalent operation for each step Python Code .