Now we have 2015 To 2017 year 25 Ten thousand 911 Emergency call data , Please count out these data Number of different types of emergencies , If we still want to figure out Different types in different months Changes in the number of emergency calls , What should be done ?
First, check the data ,(df.head,df.info) This data has longitude and latitude ,twp Location , Number ) Classification in title Before the middle colon
See if there is any missing ,
# Get the classification df["title"].str.split(":")[0]# Go to Series The first value in the list ( Using traversal )
temp_list=df["title"].str.split(":").to_list()#
cate_list=list(set([i[0] for i in temp_list[])
# Statistical classification , Construct an array with all zeros ,
zeros_df=pd.DataFrame(np,zeros(df.shape[0].len(cate_list),columns=cate_list)
# assignment
for cate in cate_list:
df['title
Different months , Cut according to the horizontal line ,(2015-2017) Cut horizontally on the right , Grouped by month , Create a new column { classification ) Three types of fire,traffic,ems,
np.array(cate_list).reshape((df.shape[0],1)columns="cate")
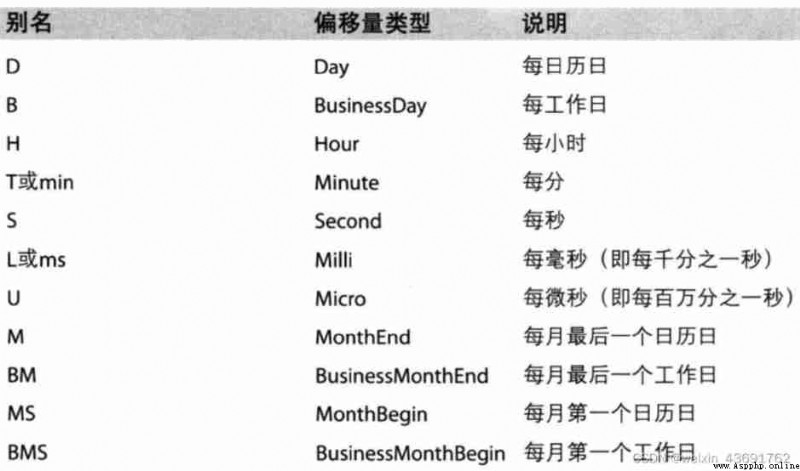
pandas The time series ; Time string pd.date.range(start,end,periods,freq)
Generate a time range , Abbreviation for frequency
DataFrame Use time series
index=pd.date.range() Generate the index of time series , have access to pandas The method provided converts the time string into a time series and converts a index Convert to time series as index .pd.to_datatime() Be able to put a seiries String to pandas type ( Time type ) see 2015/12/15 Number of calls that have occurred
pandas Resampling : It refers to the process of converting time series from one frequency to another for processing, and converting high-frequency data into low-frequency data as down sampling , The low frequency is converted into u High frequency sampling in liters
t.resample("M").mean() Calculate the average value by month
t.resample("M").count()
problem : Changes in the number of calls in different months ?
Convert statistics per second into monthly statistics .count(), Draw a line .
pM2.5 Convert time format to :PeriodIndex( Pass some parameters PERIODS=pd.PeriodIndex(year=df.["year"],mounth=df["month"],day=df=df["day"],hour=df["hour"],freq=)
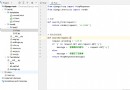
# coding=utf-8
import pandas as pd
import numpy as np
from matplotlib import pyplot as plt
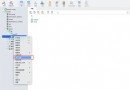
df = pd.read_csv("./911.csv")
df["timeStamp"] = pd.to_datetime(df["timeStamp"])# Conversion time type
df.set_index("timeStamp",inplace=True)
# According to the statistics 911 The number of calls in different months in the data
count_by_month = df.resample("M").count()["title"]
print(count_by_month)
# drawing
_x = count_by_month.index
_y = count_by_month.values
# for i in _x:
# print(dir(i))
# break
_x = [i.strftime("%Y%m%d") for i in _x]
plt.figure(figsize=(20,8),dpi=80)
plt.plot(range(len(_x)),_y)
plt.xticks(range(len(_x)),_x,rotation=45)
plt.show()