brief introduction :memory_profiler Is a third-party module , Used to monitor the memory consumption of the process and python Line by line analysis of program memory consumption . It's a pure python modular , Depend on psutil modular .
install :
pip install memory_profiler
Usage method :
1、 Run through finisher
@profile
def func1():
2、 Run... From the command line
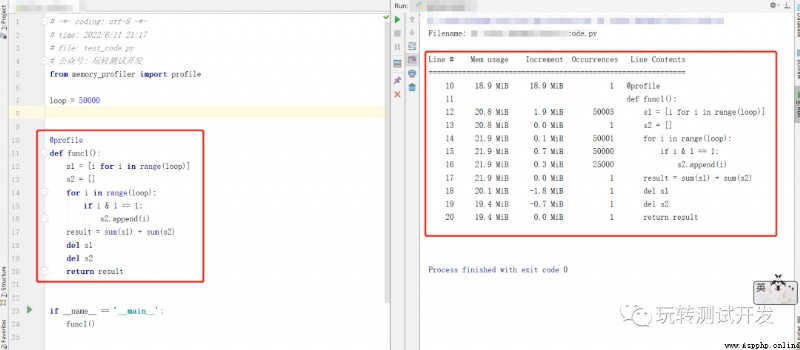
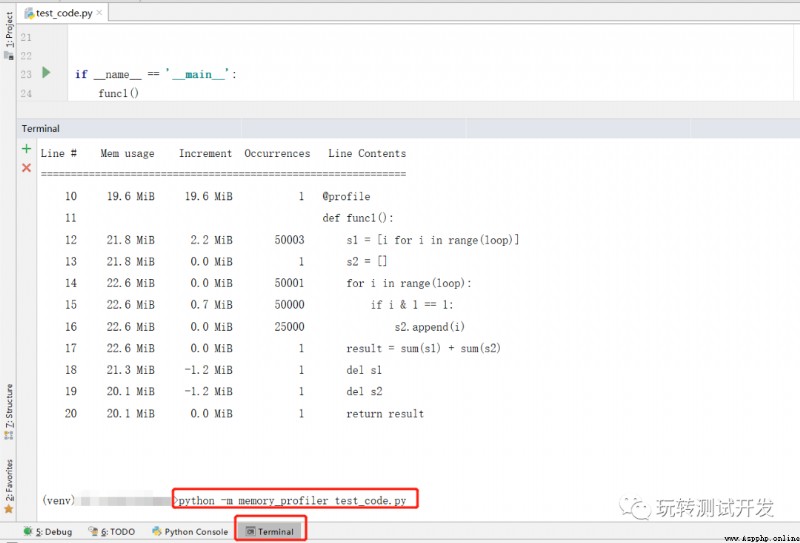
python -m memory_profiler test_code.py
Source code of case :
# -*- coding: utf-8 -*-
# time: 2022/6/11 21:17
# file: test_code.py
# official account : Play with test development
from memory_profiler import profile
loop = 50000
@profile
def func1():
s1 = [i for i in range(loop)]
s2 = []
for i in range(loop):
if i & 1 == 1:
s2.append(i)
result = sum(s1) + sum(s2)
del s1
del s2
return result
if __name__ == '__main__':
result = func1()
print(result)
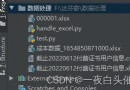
Method 1 Running results :
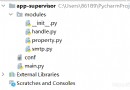
Method 2 Running results :
WeChat official account : Play with test development
Welcome to your attention , Common progress , thank you !