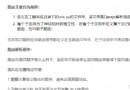
簡介:memory_profiler是第三方模塊,用於監視進程的內存消耗以及python程序內存消耗的逐行分析。它是一個純python模塊,依賴於psutil模塊。
安裝:
pip install memory_profiler
使用方法:
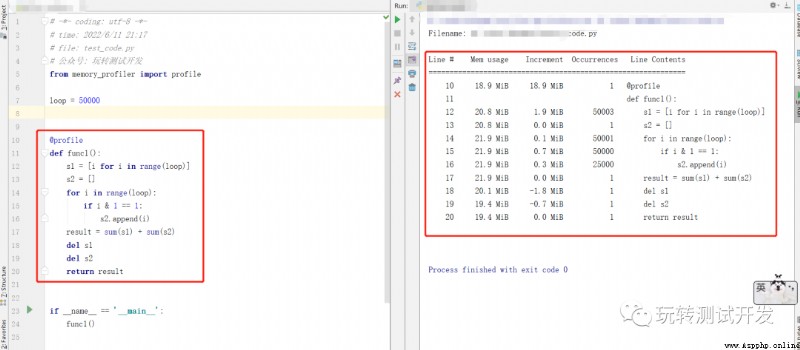
1、通過裝飾器運行
@profile
def func1():
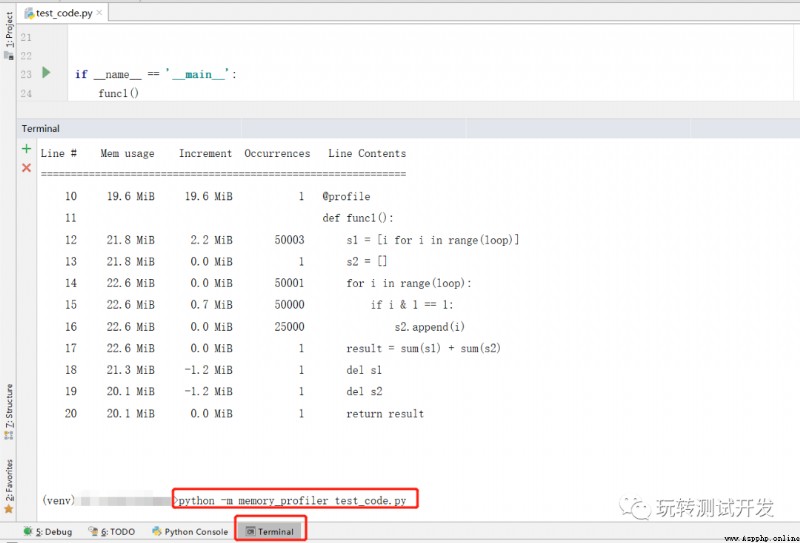
2、通過命令行運行
python -m memory_profiler test_code.py
案例源碼:
# -*- coding: utf-8 -*-
# time: 2022/6/11 21:17
# file: test_code.py
# 公眾號: 玩轉測試開發
from memory_profiler import profile
loop = 50000
@profile
def func1():
s1 = [i for i in range(loop)]
s2 = []
for i in range(loop):
if i & 1 == 1:
s2.append(i)
result = sum(s1) + sum(s2)
del s1
del s2
return result
if __name__ == '__main__':
result = func1()
print(result)
方法1運行結果:
方法2運行結果:
微信公眾號:玩轉測試開發
歡迎關注,共同進步,謝謝!