(https://github.com/MLEveryday/100-Days-Of-ML-Code.git)
explain : In the article python Most of the code comes from github( A few tests are added during learning ), The attached notes are for study notes .
Data preprocessing –> Training a simple linear regression model through a training set –> Predicted results –> visualization
# Day2:Simple_Linear_Regression
# 2019.2.14
# coding=utf-8
# Data Preprocessing
# 1. Introduce the required libraries
import pandas as pd
import numpy as np
import matplotlib.pyplot as plt
# 2. Import data
dataset = pd.read_csv('C:/Users/Ymy/Desktop/100-Days-Of-ML-Code/datasets/studentscores.csv');
# X To import dataset Of the 0 Column ,Y For the first time 1 Column
X = dataset.iloc[:,:1].values
Y = dataset.iloc[:,1].values
# 3. Check for missing data ( Since this data has no missing value , This step is omitted )
# 4. Divide the data set ( Percentage of test set 25%)
from sklearn.model_selection import train_test_split
X_train, X_test, Y_train, Y_test = train_test_split(X, Y, test_size = 1/4, random_state = 0)
# Fitting Simple Linear Regression Model to the training set
# 1. Use sklearn.linear_model Of LinearRegression class
from sklearn.linear_model import LinearRegression
# 2. establish LinearRegression Class object regressor, And use fit() Method
''' fit Method : def fit(self, X, y, sample_weight=None): """ Fit linear model. Parameters( Parameters ) ---------- X ( Training data ): array-like or sparse matrix, shape (n_samples, n_features) Training data y ( The target ): array_like, shape (n_samples, n_targets) Target values. Will be cast to X's dtype if necessary sample_weight : numpy array of shape [n_samples] Individual weights for each sample .. versionadded:: 0.17 parameter *sample_weight* support to LinearRegression. Returns( Return value ) ------- self : returns an instance of self. """ '''
regressor = LinearRegression()
regressor = regressor.fit(X_train, Y_train)
# Predecting the Result
# Use the method in the previous step , Predict test set results
''' predict Method : def predict(self, X): """ Predict using the linear model Parameters ---------- X : array_like or sparse matrix, shape (n_samples, n_features) Samples. Returns ------- C : array, shape (n_samples,) Returns predicted values. """ '''
Y_pred = regressor.predict(X_test)
# Visualising the Training results( Visualize training set results ,18 Group data )
# 1. draw x,y The scatter diagram of , The color of the dot is yellow
# matplotlib.pyplot Of scatter Method ( See the link at the bottom for details )
''' def scatter( x, y, s=None, c=None, marker=None, cmap=None, norm=None, vmin=None, vmax=None, alpha=None, linewidths=None, verts=None, edgecolors=None, *, data=None, **kwargs) """ Parameters ---------- x, y : array_like, shape (n, ) The data positions. s : scalar or array_like, shape (n, ), optional c : color, sequence, or sequence of color, optional """ '''
plt.scatter(X_train , Y_train, color = 'yellow')
# 2. Drawing training sets X And predicted by the training set method 'Y', The color is black
# matplotlib.pyplot Of plot Method ( See the link at the bottom for details )
plt.plot(X_train , regressor.predict(X_train), color ='black')
# 3. Show ( If it shows , The picture contains 18 A scatter )
#plt.show()
# Visualizing the test results( Visualize test set results )
# Ibid
plt.scatter(X_test , Y_test, color = 'red')
plt.plot(X_test , regressor.predict(X_test), color ='blue')
# This shows , The picture contains 25 A little bit , That is, all data
plt.show()
p1: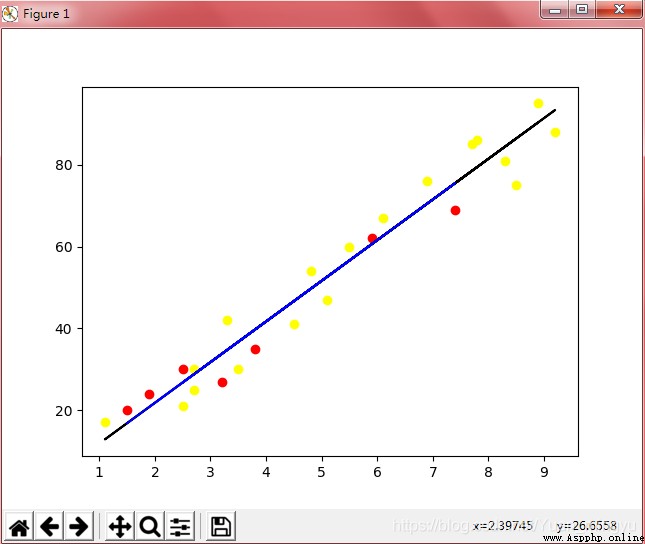
p2(train):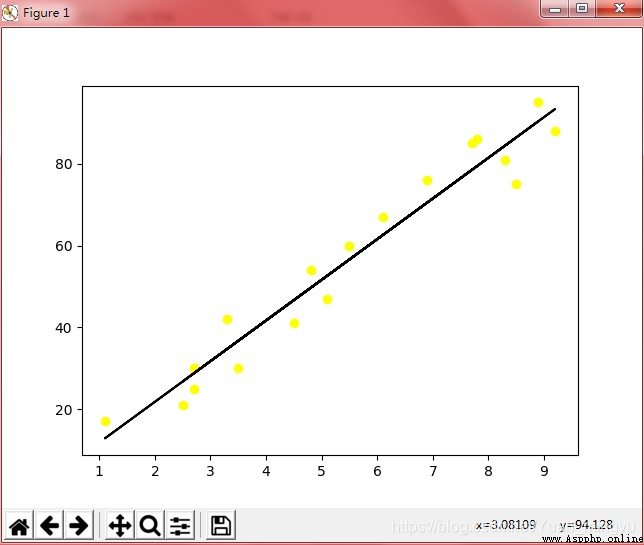
p3(test):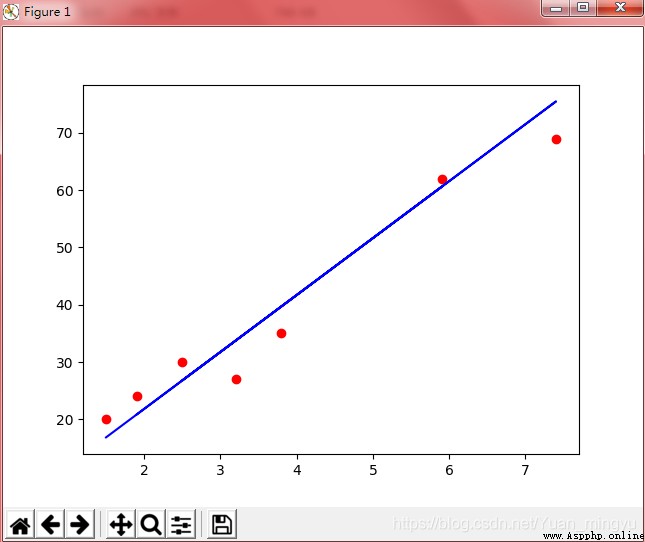
notes : Follow the code in the learning section , The output of the operation is p1; according to p1 It can be seen that , The graph contains two sets of data , by train and test The superposition of images drawn by two sets of data sets , and p2 and p3 They correspond to train and test Images drawn separately from two sets of data sets .
Reference :
sklearn.linear_model.LinearRegression:
https://scikit-learn.org/stable/modules/generated/sklearn.linear_model.LinearRegression.html
matplotlib.pyplot.scatter:
https://matplotlib.org/api/_as_gen/matplotlib.pyplot.scatter.html
matplotlib.pyplot.plot:
https://matplotlib.org/api/_as_gen/matplotlib.pyplot.plot.html#matplotlib-pyplot-plot