Purpose :
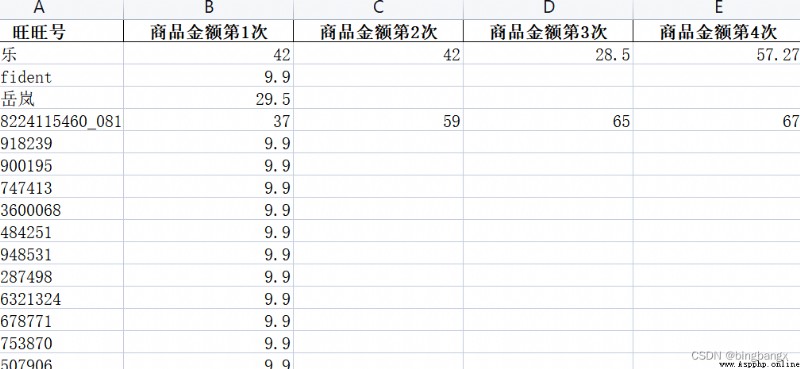
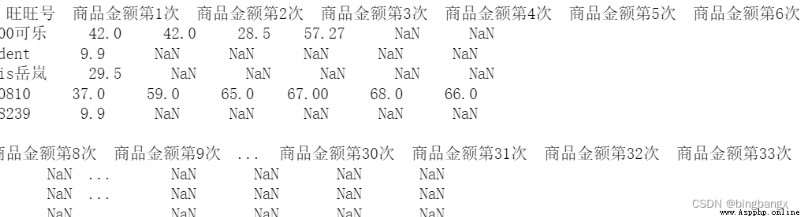
You have obtained the amount of each order placed by the user , Use Python The user's historical purchase records appear in the same line after processing the data , The column name is displayed as ( Wangwang 、 Commodity amount No 1 Time 、 Amount of goods for the second time 、……).
As shown in the figure :
Specific operation steps :
Specific implementation method :
1、 Read data into python
data = pd.read_excel(' newly build XLSX Worksheet .xlsx',sheet_name= 'Sheet1') # Read data entry Python Program
print(data.head())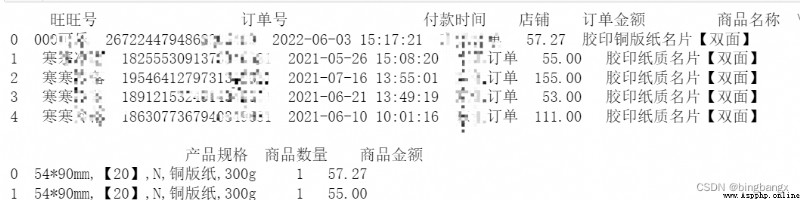
2、 According to Wangwang No 、 The order number 、 Amounts are grouped , Sort payment time
# First, aggregate the data , Make every Wangwang number + The order number + Payment time is unique
data1 = pd.pivot_table(data,values =[' The amount of goods '],index =[' Wangwang ',' The order number ',' Time of payment '],
aggfunc = {' The amount of goods ':sum}).reset_index(drop = False)
# print(data1.head())
# First set the time field , From string format to time format
data1[' Time of payment '] =data1[' Time of payment '].apply(lambda x:datetime.datetime.strptime(x,'%Y-%m-%d %H:%M:%S'))
# print(data1.head())
# According to different Wangwang numbers 、 The order number 、 amount of money , Sort payment times
data1['ranks'] = data1.groupby([' Wangwang '])[' Time of payment '].rank().astype(int)
print(data1)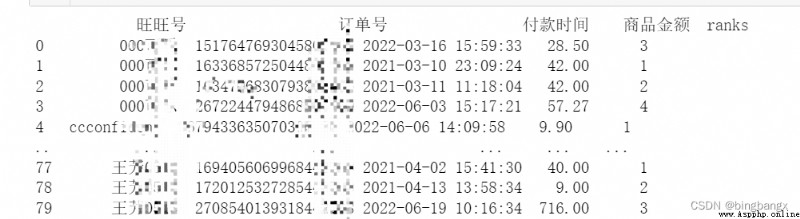
3、 Use pivot_table() Build pivot table , Rename column names , And reset the index
data2 = pd.pivot_table(data1,values=[' The amount of goods '],index = [' Wangwang '],columns =['ranks'])
# print(data2.head())
""" The pivot table has two levels of column names , The first level is the amount , The second layer is the sequence """
data2.columns.tolist() # View column names
data2.columns = [str(s1) +" The first "+str(s2)+" Time " for (s1,s2) in data2.columns.tolist()] # Rename the column name
data2.reset_index(inplace =True) # Reset index , Then flatten the index
At this point, the initial interface effect is realized .
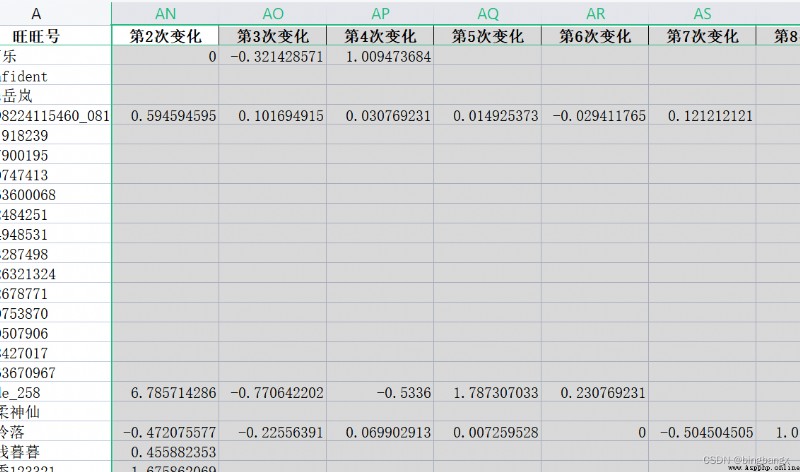
Further calculate the growth rate :
Then we can use this data , Further processing , Calculate the growth rate of consumption amount , such as : Second change :( The second consumption amount / The first consumption amount - 1); The third change :( The third consumption amount / Second, the consumption amount - 1),…… And so on .
''' Next, use the cycle to calculate the growth rate '''
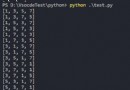
for i in range(2,39):
data2[' The first %s Changes ' %(i)] = (data2[' Commodity amount No %s Time ' % (str(i))] )/(data2[' Commodity amount No %s Time ' % (str(i-1))] ) -1
print(data2.head())The result is shown in the figure :
such , We will be realistic , The historical consumption amount of the same user is in chronological order , Horizontal data requirements ~~~~