# Course link
new django3 Introduction to project practice ( Zero basis to learn django、 Project development practice 、 College graduation design is available )_ Bili, Bili _bilibili
# Course content
(1)5-5 Order -ajax Delete ( Dialog box )
(2)5-6 Order - edit
(3)5-7 Order - Dialog logic adjustment
(4)5-8 Data statistics - Histogram
(5)5-9 Data statistics - Pie chart and line chart
# The wind breaks the waves , Sail the clouds straight to the sea
# (1) Delete function (JS Knowledge points of !!!)
1) Here are two ways to do , One is that we click the delete key of a piece of data , Then the front end will select the data id Take out the value and put it somewhere , When you click OK to delete , The system will id Send it to the background for deletion ; Another is to define a global variable , Just click delete , So the corresponding id Just assign to this global variable , When the deletion is confirmed , Send the global variables to the background ( This is also what we use later ).
It can be seen from method 2 above , We define a global variable , Then click the delete button , Of the selected data id Will be assigned to this global variable , Then confirm the deletion , then id Value is sent to the backend .
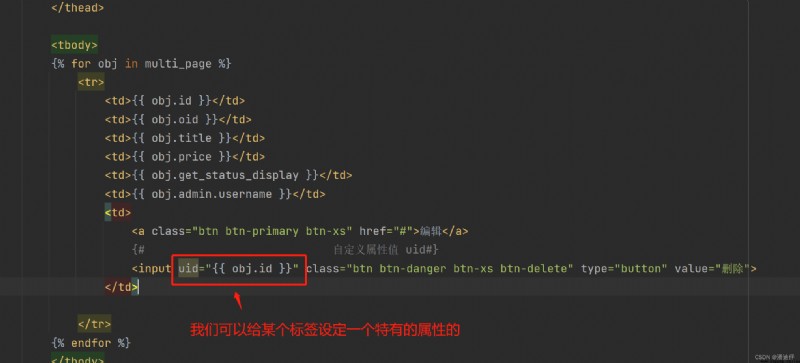
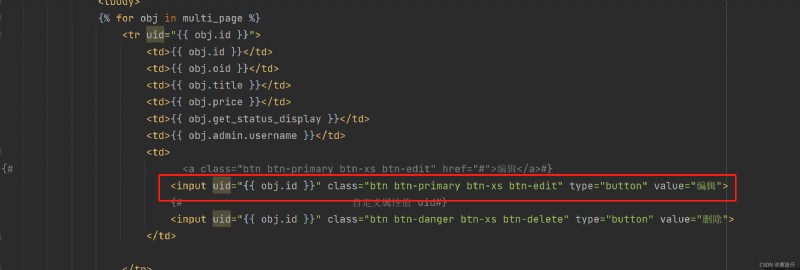
2) The front-end code . First, we need to add some special properties to the front-end editing code , In order to be the follow-up js Can index it . Just remember , Why not? . So unique properties , Namely uid="{ {obj.id}}" , It is equivalent to the data clicked id value , That is to say uid.
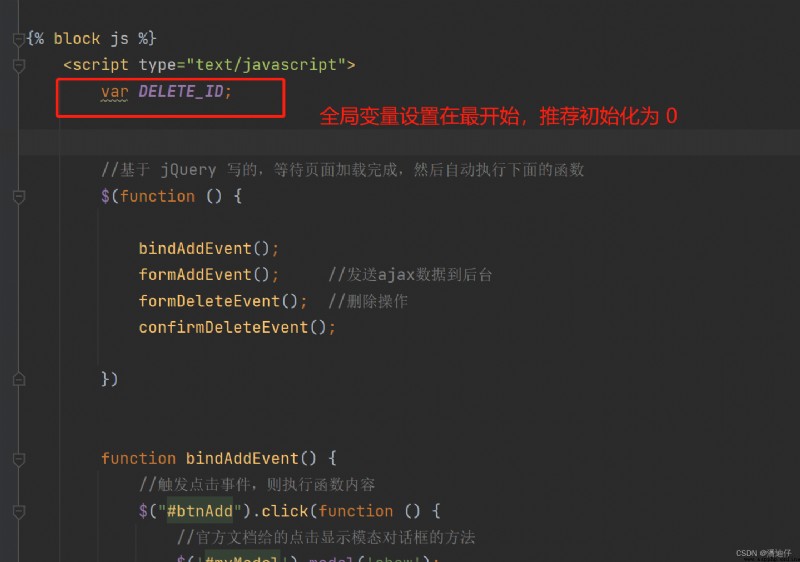
3) Then we bind a click event , Just click the delete button , Just put it id Assign to the global variable we set ( Because we follow the second method ). Yes, of course , There are also methods and functions for deleting click events formDeleteEvent() 、 Confirm to delete the method function of click event confirmDeleteEvent() , As shown in the figure .
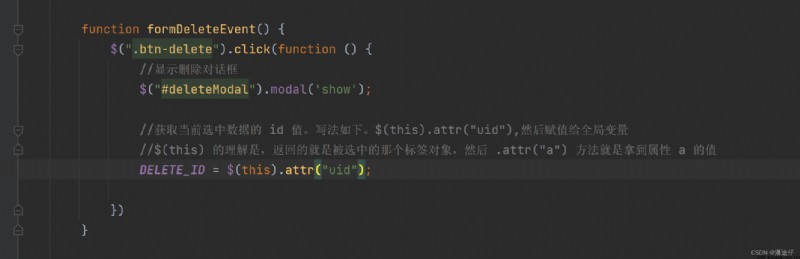
4) First, let's write formDeleteEvent() Function of . The process goes like this , Just click the delete button on a line , Then the modal dialog will be displayed , And then we'll take this line of data id Assign to global variable DELETE_ID. So how do we know which tag it is , That's using $(this) Method , Returns the currently selected label object , At the same time call attr() Method , To get uid Value . This way, , We just need to remember .
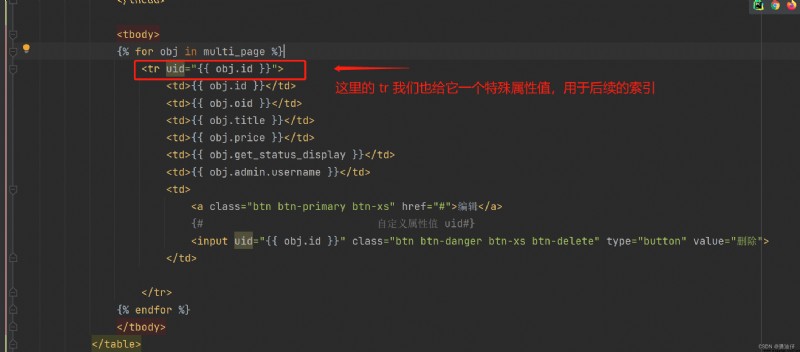
5) In the pop-up modal dialog , If the user confirms the deletion , Then we will get the global variable uid value , Back to back end , Let the backend perform the corresponding deletion operation . That is to call our method function to confirm the deletion of the click event confirmDeleteEvent(), Process is to use ajax take uid Go to the background . But before that , We need to give tr Add one to the label uid attribute , To facilitate subsequent deletion .
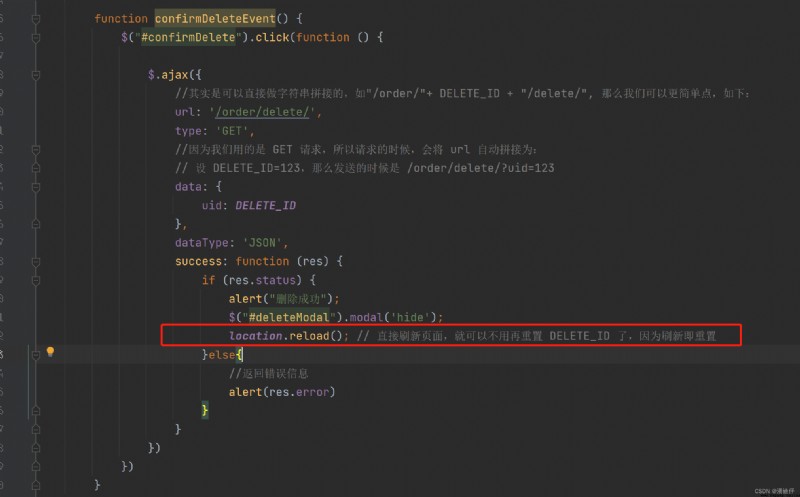
6) The first way to confirm deletion , Is to cooperate with the above tr The properties of the tag are used . Give the code directly . The format may be a little ugly , But this method is more troublesome , The detailed notes are listed below . This is mainly for learning js It's just .
function confirmDeleteEvent() {
$("#confirmDelete").click(function () {
$.ajax({
// In fact, string splicing can be done directly , Such as "/order/"+ DELETE_ID + "/delete/",
// Then we can make it simpler , as follows :
url: '/order/delete/',
type: 'GET',
// Because we use GET request , So when you ask , Will url Automatic splicing is :
// set up DELETE_ID=123, Then the time of sending is /order/delete/?uid=123
data: {
uid: DELETE_ID
},
dataType: 'JSON',
success: function (res) {
if (res.status) {
alert(" Delete successful ");
$("#deleteModal").modal('hide');
/** Delete the deleted row of data in the page ( Previously, it was only deleted in the database )
* $("tr") The index is in the page tr label . Then we index with delete uid the tr label , Delete ,
* there $("tr[uid='" + DELETE_ID + "']") It's string concatenation , among DELETE_ID Will automatically change to str type
* set up Str1: "tr[uid='"
* Str2: DELETE_ID
* Str3: "']" , So the above formula is $(Str1 + Str2 + Str3)
* If you delete it, you will execute remove() Method . namely
* $("tr[uid='" + DELETE_ID + "']").remove();
* 【 Be careful 】
* But this way , Existing problems . If there is paging data , And after the deletion ,
* The data of the following pages may not be able to top the current page
*/
$("tr[uid='" + DELETE_ID + "']").remove();
// Global variable null
DELETE_ID = 0;
}else{
// Return error message
alert(res.error)
}
}
})
})
}
7) Confirm the deletion method 2 , This is pretty simple , That is, we delete , And hide the modal dialog , Directly and automatically refresh the page .
# (1) Indexes id( This is the elementary way of writing )
1) In fact, the edited index id The logic is to delete the index id Logic is the same . The same set of unique properties , and js Code , Here we go straight to the code .
2)js Code . The basic logic is , After each click on the event , First clear the data of the original modal dialog box , Otherwise, different data will conflict . Find the selected id value , And then through ajax Request to send id Value to background , The background sends the original data back to the foreground , Then put it into the modal dialog box , Finally, it is presented to the user for reference .
 function bindEditEvent(){
$(".btn-edit").click(function (){
// Empty original input The data of
$("#formAdd")[0].reset();
// Find the selected row of data id
DELETE_ID = $(this).attr("uid")
//ajax Request
$.ajax({
url: '/order/edit/',
type: 'GET',
data: {
uid: DELETE_ID
},
dataType: "JSON",
success: function (res){
if (res.status){
// Data returned from the loop
$.each(res.data, function (name, key) {
$("#id_" + name).val(key)
})
}else{
alert(" Editing errors ")
}
}
})
// Change your head
$("#myModalLabel").text(" Ed Compilation ");
// Show modal dialog
$('#myModal').modal('show');
})
}
3) The code of the view function is as follows , See the following figure for more detailed notes .
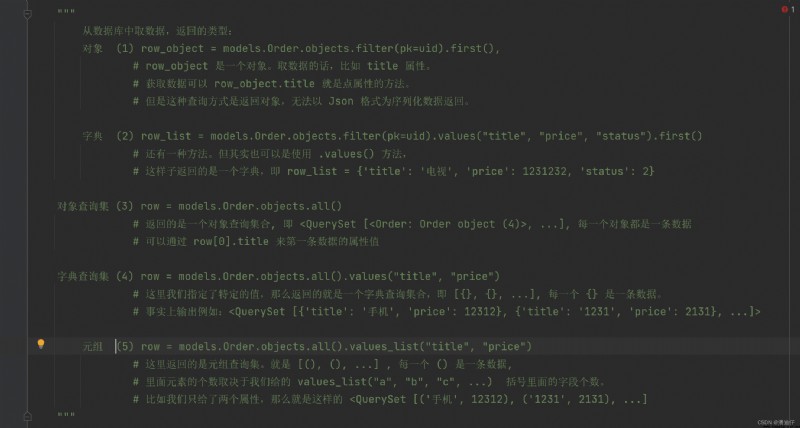
def order_edit(request):
uid = request.GET.get("uid")
"""
Take data from the database , The type of return :
(1) row_object = models.Order.objects.filter(pk=uid).first(),
# row_object It's an object . Take the data , such as title attribute .
# Getting data can row_object.title Is the method of point attributes .
# But this query method is to return objects , There is no way to Json The format is returned for serialized data .
(2) row_list = models.Order.objects.filter(pk=uid).values("title", "price", "status").first()
# There's another way . But it can also be used .values() Method ,
# This returns a dictionary , namely row_list = {'title': ' TV ', 'price': 1231232, 'status': 2}
(3) row = models.Order.objects.all()
# What is returned is a collection of object queries , namely <QuerySet [<Order: Order object (4)>, ...], Every object is a piece of data
# Can pass row[0].title The attribute value of the first data
(4) row = models.Order.objects.all().values("title", "price")
# Here we specify a specific value , Then the returned is a dictionary query set , namely [{}, {}, ...], every last {} It's a piece of data .
# In fact, output such as :<QuerySet [{'title': ' mobile phone ', 'price': 12312}, {'title': '1231', 'price': 2131}, ...]>
(5) row = models.Order.objects.all().values_list("title", "price")
# What is returned here is the tuple query set . Namely [(), (), ...] , every last () It's a piece of data ,
# The number of elements depends on what we give values_list("a", "b", "c", ...) The number of fields in parentheses .
# For example, we only give two attributes , So that's it <QuerySet [(' mobile phone ', 12312), ('1231', 2131), ...]
"""
# Here we use the above No (2) Methods
row_list = models.Order.objects.filter(pk=uid).values("title", "price", "status").first()
if not row_list:
ret = {
"code": 1002,
"status": False
}
return JsonResponse(ret)
# If the query is successful , Return the corresponding data
ret = {
"code": 1000,
"status": True,
"data": row_list
}
return JsonResponse(ret)
4) Database query review .
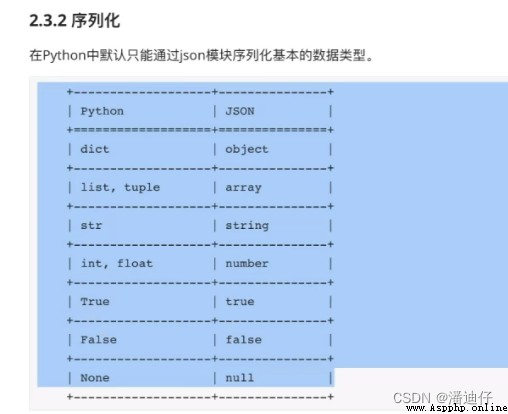
5) I say this because json The data types that can be returned are limited to the basic data types , As shown in the figure below .
# (1) Improve the process .
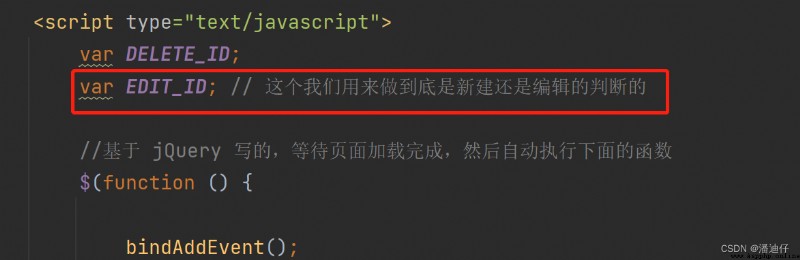
1) If you follow the above method , When we click save , It will directly become a new piece of data . This is because our new and edit modal dialogs are common . We can add a global variable to determine , Our operation is to create or edit . Here is js Code , meanwhile , We need to change the variables of the edited event .【 Add up , If a variable is undefined, Then convert to boolean Type words , Namely False, Based on this idea, we can judge whether to create or edit 】
2) The following is the complete editorial section js Code .
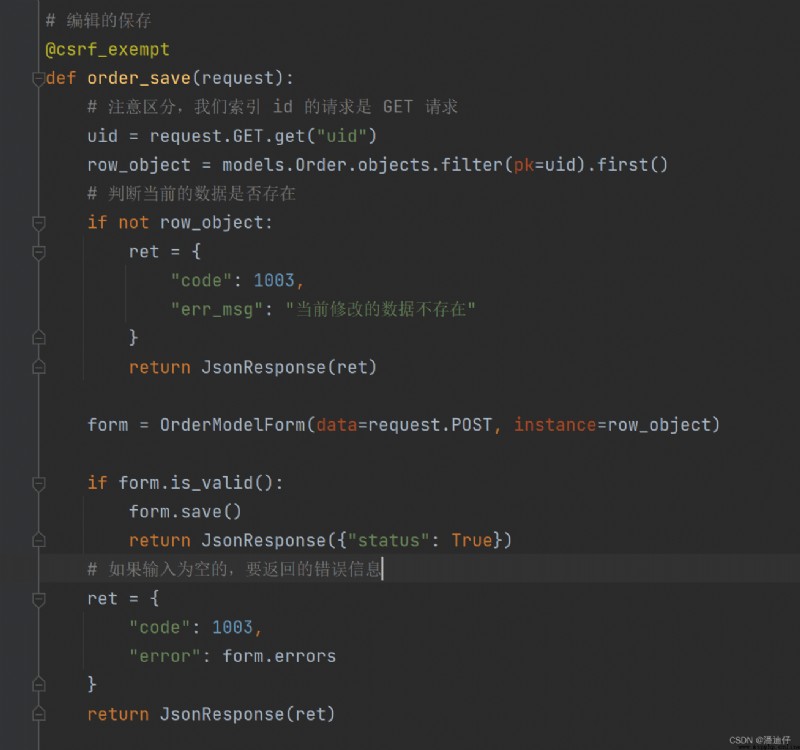
 // The modified code
function formAddEvent() {
$("#btnSave").click(function () {
$(".error-msg").empty()
if (EDIT_ID) {
// edit
$.ajax({
url: '/order/edit/save/' + "?uid=" + EDIT_ID,
type: "post",
data: $("#formAdd").serialize(),
dataType: "JSON",
success: function (res) {
if (res.status) {
alert(" Edit success ")
// After saving successfully , Empty the form .
// because jQuery There is no empty function , So by $("#formAdd")[0] To bind a DOM object
// call .reset() Method to empty the input field .
$("#formAdd")[0].reset();
// Automatically close after saving successfully
$("#myModal").modal('hide');
// After saving successfully , The method of automatic page refresh .
location.reload();
} else {
if (res.err_msg) {
alert(res.err_msg)
console.log(res.status)
} else {
$.each(res.error, function (name, err) {
$("#id_" + name).next().text(err[0])
})
}
}
}
})
}
else {
$.ajax({
url: '/order/add/',
type: "post",
data: $("#formAdd").serialize(),
dataType: "JSON",
success: function (res) {
if (res.status) {
alert(" Saved successfully ")
// After saving successfully , Empty the form .
// because jQuery There is no empty function , So by $("#formAdd")[0] To bind a DOM object
// call .reset() Method to empty the input field .
$("#formAdd")[0].reset();
// Automatically close after saving successfully
$("#myModal").modal('hide');
// After saving successfully , The method of automatic page refresh .
location.reload();
} else {
$.each(res.error, function (name, err) {
{#console.log(name, err)#}
$("#id_" + name).next().text(err[0])
})
}
}
})
}
})
}
3) The view functions we edit and save are as follows :
# (1) Third party library for drawing
1) There are two kinds of drawing libraries currently used , One is from abroad highcharts, Another one is domestic echarts, This martial art sir mainly echarts As an example .
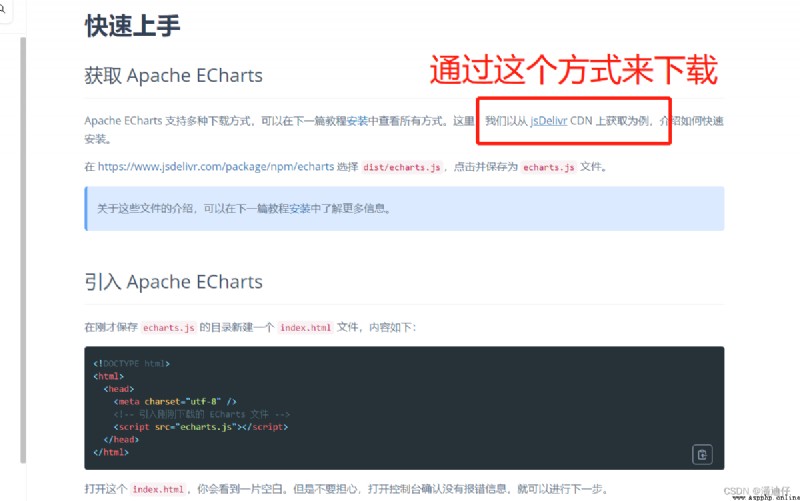
2)echarts Basic use of . Open the link :Handbook - Apache ECharts , We can see the following interface , Choose to pass jsDelevr CDN To download .
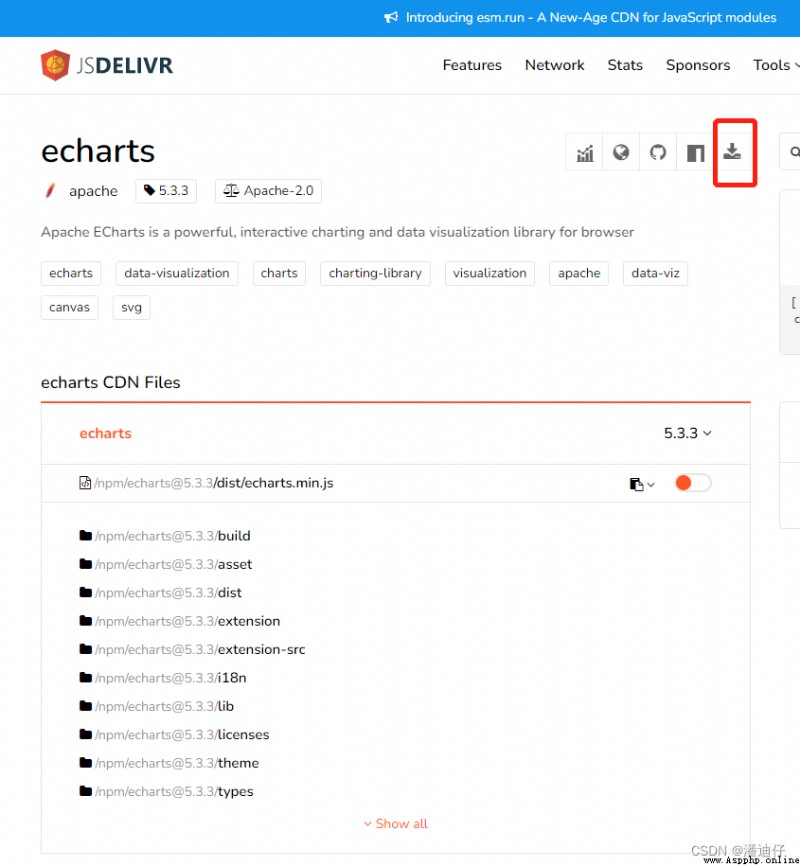
Use CDN When downloading , We can come to the following interface , Then click the download in the red box directly . Download a similar to demo The compressed file of , We just need to unzip to find /dist/echarts.min.js that will do . And then talk about this js The documents are in us django Project static/js/ Under folder .CDN Through train :echarts CDN by jsDelivr - A CDN for npm and GitHub
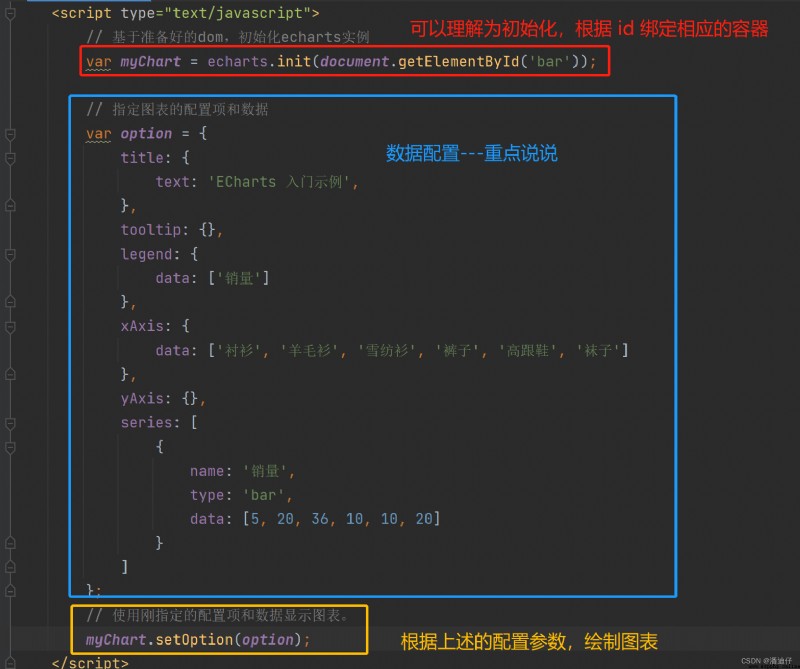
3) Then we directly configure a simple route and front-end page , To use echarts Official sample code , Draw a histogram . Of course, before that, we need to make one with id = bar , With length and width div label .
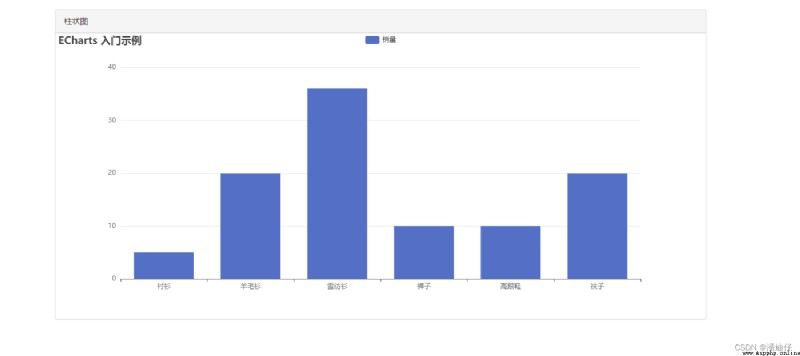
The displayed results are as shown in Figure :
# (2) Data configuration of sample code ( This section is mainly written by myself )
This section is mainly used to consult and debug the view with the help of documents , We just need to know the basic usage , You can refer to the document as needed , Document links : Documentation - Apache ECharts
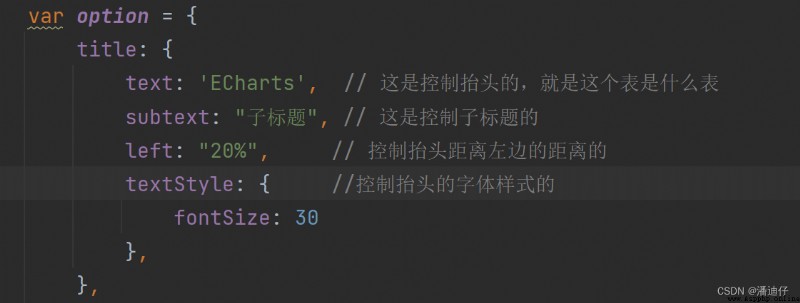
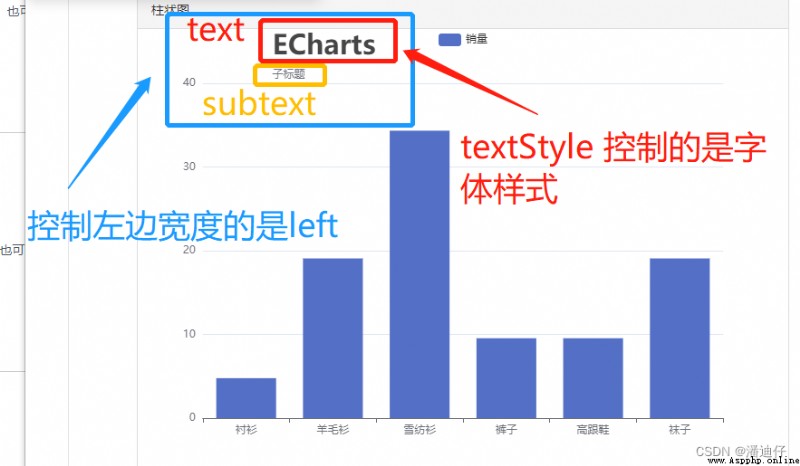
1)title Configuration of . title There is a dictionary ( Note that js Of ), The format is title: {}. Take the following example , We wrote notes for some common attributes . For more information, please refer to the documentation .
The results are shown in the following figure :
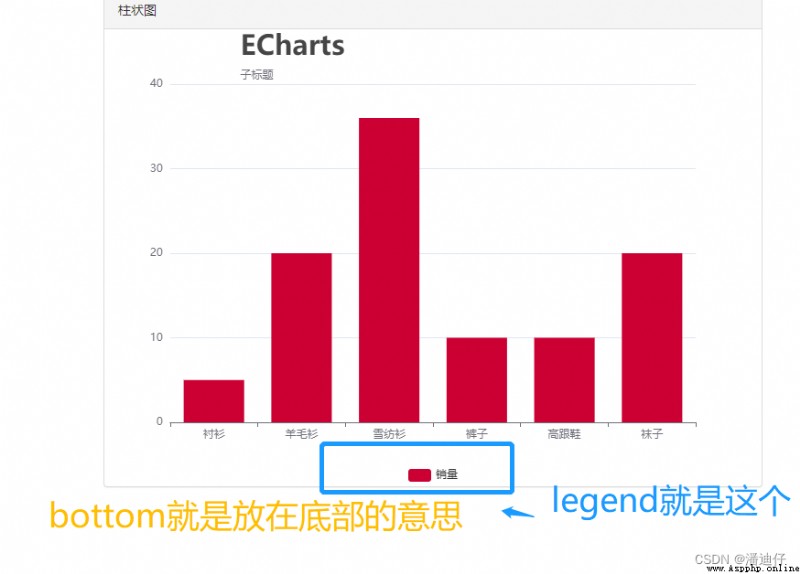
2)legend Configuration of . This is to configure the data ID . Look directly at the code :
So what is more intuitive is , obviously data Is the name of the data identifier .
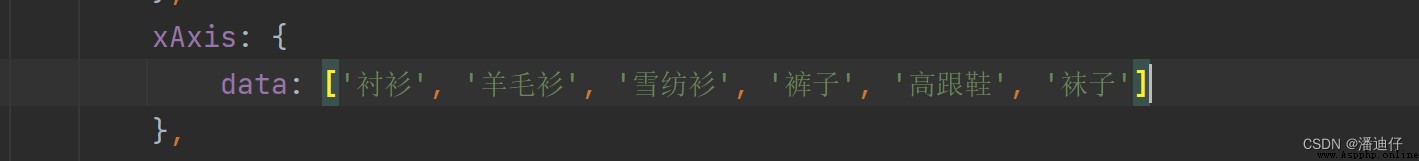
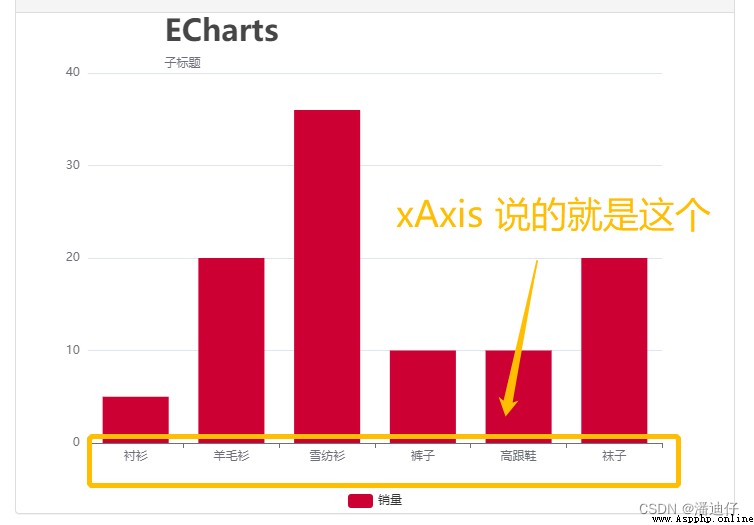
3)xAxis Is the horizontal axis of the table , More can view the document to use . yAxis The vertical axis , This is basically done by consulting the documents
As shown in the figure :
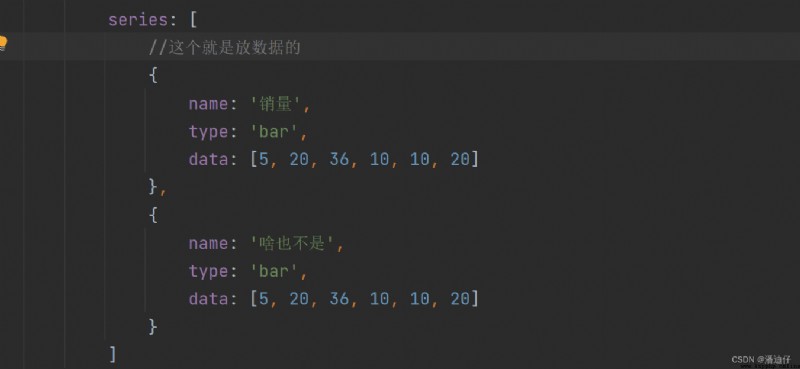
4)series Is to put data , We put two pieces of data in . As shown in the figure below ,
Then the final result is as follows :
【 All in all , When it's time to use , Go directly to the document 】
# (3) Request data to draw a histogram
1) Simulation request data , Then automatically draw . First of all js Code for .
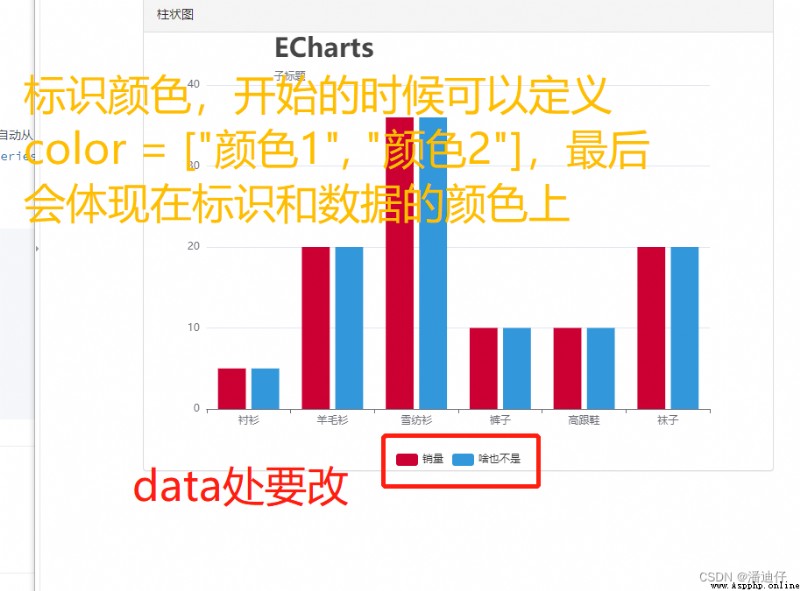
 <script type="text/javascript">
$(function () {
paintBar();
})
function paintBar() {
// Based on the prepared dom, initialization echarts example
var myChart = echarts.init(document.getElementById('bar'));
//bar Special for drawings
var option = {
color: [],
title: {},
tooltip: {},
legend: {
data: [],
bottom: 0
},
xAxis: {
data: []
},
yAxis: {},
series: []
}
$.ajax({
url: '/charts/bar/',
type: 'get',
dataType: 'JSON',
success: function (res) {
if (res.status) {
option.color = res.color;
option.title = res.title
option.legend.data = res.title.data
option.xAxis.data = res.xAxis.data
option.series = res.series
// Show
myChart.setOption(option);
}
},
})
}
</script>
2) Back end view function :
def charts_bar(request):
ret = {
"status": True,
"color": ["#CC0033", "#3398DB"],
"title": {
"text": 'ECharts',
"subtext": " Subtitle ",
"left": "20%",
"textStyle": {
"s": 30
}
},
"legend": {
"data": [' sales ', " Nothing "],
"bottom": "0%"
},
"xAxis": {
"data": [' shirt ', ' Woolen sweater ', ' Snow spins unlined upper garment ', ' The trousers ', ' High heels ', ' socks ']
},
"series": [
{
"name": ' sales ',
"type": 'bar',
"data": [5, 20, 36, 10, 10, 20]
},
{
"name": ' Nothing ',
"type": 'bar',
"data": [5, 20, 36, 10, 10, 20]
}
]
}
return JsonResponse(ret)
【 All in all , See more echarts Documents , And pay attention to the format of the returned data .】
# link ~~~ I'll read it again when I have time . It is mainly learned in combination with documents .
new django3 Introduction to project practice ( Zero basis to learn django、 Project development practice 、 College graduation design is available )_ Bili, Bili _bilibili