1、 What I want to achieve
Draw a line chart with the abscissa of the product name , Profit ordinate , Where you want to automatically read x,y And make them interrelated , Can draw a line chart
2、 Problem related codes and running results
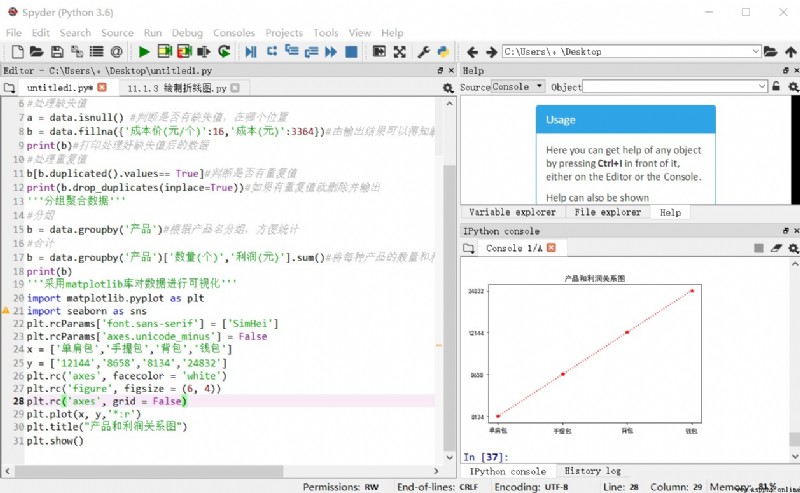
In the case of this code, the output results are one-to-one correspondence , No matter the size of the number is a straight line , Does not meet the requirements of the broken line .
3、 My solution ideas and tried methods
utilize matplotlib Visualizing , Set separately x,y And picture information, and then draw pictures , At this time, you get the picture above , Then my idea is to create two dictionaries that correspond to each other , But how to read dictionary data ? How can I make the items in the dictionary be displayed one by one when I use it ?
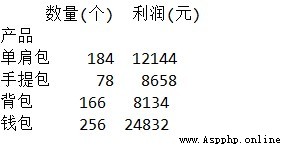
4、b Table data